

Thoughts Regarding a “K-Shaped” Economy
INVESTMENT COMMITTEE COMMENTARY November 2025
November was a volatile month for the U.S. stock market. Leading stock indexes declined for three straight weeks as investor sentiment slipped on concerns about the valuation of megacap tech stocks. However, as more economic data became available following the reopening of the federal government, the market staged a strong rebound. The late-month rally was largely driven by renewed hopes for a Federal Reserve (Fed) interest rate cut in December (Since the drafting of this article, the Fed did, in fact, reduce rates by 0.25%). Most benchmark equity indexes ended November with modest gains.
The U.S. bond market was primarily driven by Fed policy and concerns of inflation, slowing jobs growth, and the impact of the government shutdown. Not all economic data has been reported following the shutdown. With lingering uncertainties, there remains tension between the short and long ends of the U.S. Treasury yield curve. This is displayed by a “U-shaped” yield curve pivoting at about 2–3 years. The short-end of the curve (6-months to 2-years) appears to indicate the Fed will cut rates further. The long-end of the curve (3-years to 10-years) indicates interest rates are fine at current levels. The Fed will continue to balance rising inflationary pressures against a softer labor market.
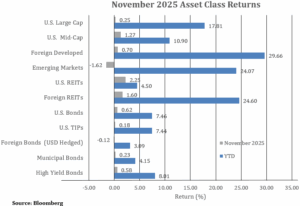
The yield on 10-year Treasuries fell from 4.11% to 4.02% and the Bloomberg U.S. Aggregate Bond Index rose 0.6% for the month.
Thoughts Regarding a “K-Shaped” Economy
On an overall basis, the U.S. economy continues to perform in a manner similar to the top of the economic cycle. Consumer spending has been resilient with recent same store retail sales growing at about 5% year over year (Redbook Research). The Fed continues to work toward the economic “soft landing” to set the economy up for the next growth cycle. The return on assets and profitability from artificial intelligence (AI) capital investment will be a critical factor as to the trajectory of the economy in years ahead. High current valuations in AI technology companies indicate that investors remain confident in the future earnings potential to carry the U.S. economy.
Broadly speaking, there are only two ways humans gain wealth to survive, live life, and support their families.
The first is through wage or self-employment income. In short, sweat. People are compensated for their time and productivity at work and receive earned income through paychecks or their self-employed profits. Income growth benefits this group.
The second is through investment capital. People invest their savings to earn interest, dividends and capital gains from the (hopefully) profitable use of their financial and personal assets. In short, return on investment assets. Returns on asset growth benefit this group.
The economic environment impacts the financial success of the first and second groups differently. For example, inflation and stagnant or flat earnings can more negatively impact wage earners who materially rely on earned income on a “paycheck to paycheck” basis. Alternatively, recessions and asset bubbles may more materially impact asset saving investors. For example, the dot-com economy followed years later by the Great Financial Crisis recession and real estate bubble brought striking changes in investor sentiment and asset values.
Recent financial news articles have highlighted a “K-shaped economy”. The concept is that at a particular point in time, the financial “winners” flourish on the upper arm of the K-economy while the financial “losers” struggle with stagnant income or capital losses on the lower arm of the K-economy. With greater disparity between income returns and asset returns, the K-economy is more noticeable. Today, many lower and middle-income households find themselves struggling to navigate a higher inflation and lower growth period. They are more reliant on income growth than asset growth. While the economy is always “K-shaped” to some degree, it is more noticeable now and it takes longer time periods for individuals to recover from higher prices and perhaps transition to higher skill jobs.
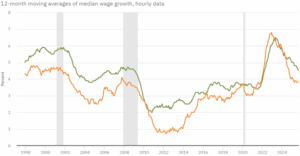
Below is a chart from the Federal Reserve Bank of Atlanta. It shows wage growth over time comparing high skill and low skill workers. Not surprisingly, there has been higher wage growth (roughly 1%) for high skilled over low skilled workers over time. However, that changed in the COVID period where wage growth was very similar between high and low skilled workers. Yet, wage growth for either segment did not keep up with inflation in the 2022 peak period. Most recently, however, the wage growth is reverting to the historical trend which is less favorable and more challenging for lower skill workers.
Federal Reserve Bank of Atlanta
Wage Growth Tracker by Occupation
![]()
![]()
In summary, the microeconomic K-shaped economy impacts individuals or groups differently based on their circumstances. However, the overall U.S. economy requires a different macro view that considers the entire population, which will create winners and losers more generally, with some companies, industries, and job categories doing well, while others suffer. The key is the ability to adapt and continue to adjust to the risk.
From an investment perspective, this environment likely increases the range of potential outcomes, and possibly volatility. While the promise of higher returns from making the right “bets” is enticing, the potential cost of getting a “bet” wrong has also increased. At JMG, because we invest with the purpose of fulfilling our clients’ financial plans and meeting their individual goals and objectives, we invest to maintain consistent risk exposures and preserve capital through the economic cycle. We therefore favor a diversified approach with moderate, targeted, tax aware shifts in portfolios over wholesale thematic bets.
If you have any questions, please consult your JMG Advisor.
Important Disclosure
Please remember that past performance may not be indicative of future results. Different types of investments involve varying degrees of risk, and there can be no assurance that the future performance of any specific investment, investment strategy, or product (including the investments and/or investment strategies recommended or undertaken by JMG Financial Group Ltd. (“JMG”), or any non-investment related content, made reference to directly or indirectly in this writing will be profitable, equal any corresponding indicated historical performance level(s), be suitable for your portfolio or individual situation, or prove successful. Due to various factors, including changing market conditions and/or applicable laws, the content may no longer be reflective of current opinions or positions. Moreover, you should not assume that any discussion or information contained in this writing serves as the receipt of, or as a substitute for, personalized investment advice from JMG. To the extent that a reader has any questions regarding the applicability of any specific issue discussed above to his/her individual situation, he/she is encouraged to consult with the professional advisor of his/her choosing. JMG is neither a law firm, nor a certified public accounting firm, and no portion of the content provided in this writing should be construed as legal or accounting advice. A copy of JMG’s current written disclosure Brochure discussing our advisory services and fees is available upon request. If you are a JMG client, please remember to contact JMG, in writing, if there are any changes in your personal/financial situation or investment objectives for the purpose of reviewing/evaluating/revising our previous recommendations and/or services, or if you would like to impose, add, or to modify any reasonable restrictions to our investment advisory services. JMG shall continue to rely on the accuracy of information that you have provided.
To the extent provided in this writing, historical performance results for investment indices and/or categories have been provided for general comparison purposes only, and generally do not reflect the deduction of transaction and/or custodial charges, the deduction of an investment management fee, nor the impact of taxes, the incurrence of which would have the effect of decreasing historical performance results. It should not be assumed that your account holdings correspond directly to any comparative indices. Indices are not available for direct investment.
Market Segment (index representation) as follows: U.S. Large Cap (S&P Total Return); U.S. Mid-Cap (Russell Midcap Index Total Return); Foreign Developed (FTSE Developed Ex U.S. NR USD); Emerging Markets (FTSE Emerging NR USD); U.S. REITs (FTSE NAREIT Equity Total Return Index); Foreign REITs (FTSE EPRA/NAREIT Developed Real Estate Ex U.S. TR); U.S Bonds (Bloomberg US Aggregate Bond Index); U.S. TIPs (Bloomberg US Treasury Inflation-Linked Bond Index); Foreign Bond (USD Hedged) (Bloomberg Global Aggregate Ex US TR Hedged); Municipal Bonds (Bloomberg US Municipal Bond Index); High Yield Bonds (Bloomberg US Corporate High Yield Index).