

Federal Government Shutdown – The Federal Reserve and Alternative Data
INVESTMENT COMMITTEE COMMENTARY October 2025
Stock indices were generally higher in October. Market volatility was higher as the federal government shutdown remained in place and is now the longest shutdown in U.S. history.
President Trump and President Xi of China made progress with a “trade truce” which lowered certain tariffs, provided clarity on rare earth minerals restrictions, and provided for China resuming soybean purchases from U.S. farmers. Also, artificial intelligence (AI) corporate earnings were solid with key companies reaffirming their capital expenditure plans.
The government shutdown has hampered the release of important economic data, making it more difficult to gauge the state of the economy. For instance, labor market data is lacking, as is the latest information on gross domestic product (GDP). However, the Consumer Price Index (CPI) was released and reported headline inflation at 3.0%, above the low in April 2025 of 2.3%. Rising commodities prices are the main reason for the increase in CPI over that time frame.
As expected, the Federal Reserve (Fed) cut interest rates for the second time this year. This helped support higher S&P 500 valuations. For the month, the S&P 500 rose 2.3%. As noted above, stock performance was influenced by technology stocks as AI carried the markets in October. Overall, the percentage of S&P 500 companies reporting positive earnings surprises was about 83% through the third quarter.
The U.S. bond market was primarily driven by Fed policy, inflation data, slowing jobs growth, and the impact of the government shutdown. The yield on 10-year Treasuries fell from 4.16% to 4.11% and the Bloomberg U.S. Aggregate Bond Index rose 0.6% for the month.

Federal Government Shutdown – The Federal Reserve and Alternative Data
The ongoing U.S. government shutdown has policymakers and investors operating without much of the timely official data that usually informs their decisions. In particular, this could have a tangible impact on Fed policy. Without crucial information on inflation and labor markets, the Fed could take a more cautious approach to interest rate moves while it awaits more clarity on the state of the U.S. economy.
One of the most important jobs of the Fed is keeping the economy healthy. The Federal Reserve System has a dual mandate: price stability and pursuing the economic goals of maximum employment. This is done using a variety of monetary policy tools to manage financial conditions that encourage progress toward its dual mandate objectives.
- Price Stability: The Fed monitors inflation as the first part of its dual mandate. Price stability means that inflation remains low and stable over longer periods. When inflation is low and stable, people can hold money without having to worry that high inflation will erode its purchasing power. The Fed steadfastly seeks to achieve approximately two percent inflation.
- Maximum Employment: The other part of the Fed’s dual mandate is maximum employment. Maximum employment can be thought of as the highest level of employment that the economy can sustain over time. Measuring this concept is hard because the level of maximum employment varies over time with business conditions, demographics, labor market regulations, and other factors. The Fed considers a wide range of employment indicators to estimate the shortfalls of employment from its maximum level. Therefore, the Fed does not have a numerical target for the level of employment and uses a wide range of data to design policies that achieve maximum employment.
The goals of price stability and maximum employment are generally complementary. An economy with low and stable inflation provides economic conditions that are friendly to business planning, saving, and investing, which results in a growing economy. A growing economy needs workers to produce goods and services.
However, there are times when the goals are not complementary. In the late 1970s and early 1980s, for example, the economy experienced both high inflation and high unemployment. The October Fed meeting highlighted today’s more complex circumstances of clashing policy and economic forces weighing on the U.S. labor market.
Fed Chair Jerome Powell said the lack of key economic data caused by the government shutdown has given the Fed an unclear view of the economy, “like driving in the fog”. With less clarity, the Fed could slow its expected policy move of a December rate cut. Powell’s comments somewhat disappointed investors and highlighted differing views between Fed members as to the speed and direction of policy interest rates.
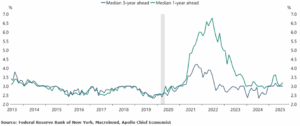
The following two charts from Apollo Global Management illustrate alternative data available to the Fed during the shutdown. The first relates to consumer inflation expectations and the second relates to employment expectations.
FRBNY survey of inflation expectations
Employment expectations
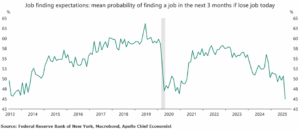
The data shows that inflation expectations remain above the Fed’s 2% with low expectations of achieving the stated target level in the near future. Regarding employment, the jobs market appears to be weakening which would support a December rate cut and be a tailwind for equity markets. Conversely, higher inflation could lead to the Fed pausing/delaying on the next rate cut. On balance, the markets are expecting a December rate cut to support economic growth and jobs.
Regarding the government shutdown, Congress faces growing pressures: missed and delayed food assistance payments (which affect millions of Americans), rising health insurance premiums for Affordable Care Act enrollees, and troubling air traffic issues. These pressures should lead politicians to come to a resolution to reopen the government.
If you have any questions, please consult your JMG Advisor.
Important Disclosure
Please remember that past performance may not be indicative of future results. Different types of investments involve varying degrees of risk, and there can be no assurance that the future performance of any specific investment, investment strategy, or product (including the investments and/or investment strategies recommended or undertaken by JMG Financial Group Ltd. (“JMG”), or any non-investment related content, made reference to directly or indirectly in this writing will be profitable, equal any corresponding indicated historical performance level(s), be suitable for your portfolio or individual situation, or prove successful. Due to various factors, including changing market conditions and/or applicable laws, the content may no longer be reflective of current opinions or positions. Moreover, you should not assume that any discussion or information contained in this writing serves as the receipt of, or as a substitute for, personalized investment advice from JMG. To the extent that a reader has any questions regarding the applicability of any specific issue discussed above to his/her individual situation, he/she is encouraged to consult with the professional advisor of his/her choosing. JMG is neither a law firm, nor a certified public accounting firm, and no portion of the content provided in this writing should be construed as legal or accounting advice. A copy of JMG’s current written disclosure Brochure discussing our advisory services and fees is available upon request. If you are a JMG client, please remember to contact JMG, in writing, if there are any changes in your personal/financial situation or investment objectives for the purpose of reviewing/evaluating/revising our previous recommendations and/or services, or if you would like to impose, add, or to modify any reasonable restrictions to our investment advisory services. JMG shall continue to rely on the accuracy of information that you have provided.
To the extent provided in this writing, historical performance results for investment indices and/or categories have been provided for general comparison purposes only, and generally do not reflect the deduction of transaction and/or custodial charges, the deduction of an investment management fee, nor the impact of taxes, the incurrence of which would have the effect of decreasing historical performance results. It should not be assumed that your account holdings correspond directly to any comparative indices. Indices are not available for direct investment.
Market Segment (index representation) as follows: U.S. Large Cap (S&P Total Return); U.S. Mid-Cap (Russell Midcap Index Total Return); Foreign Developed (FTSE Developed Ex U.S. NR USD); Emerging Markets (FTSE Emerging NR USD); U.S. REITs (FTSE NAREIT Equity Total Return Index); Foreign REITs (FTSE EPRA/NAREIT Developed Real Estate Ex U.S. TR); U.S Bonds (Bloomberg US Aggregate Bond Index); U.S. TIPs (Bloomberg US Treasury Inflation-Linked Bond Index); Foreign Bond (USD Hedged) (Bloomberg Global Aggregate Ex US TR Hedged); Municipal Bonds (Bloomberg US Municipal Bond Index); High Yield Bonds (Bloomberg US Corporate High Yield Index).