

U.S. Mid-Term Election Implications and Early November Market Volatility
INVESTMENT COMMITTEE COMMENTARY October 2026
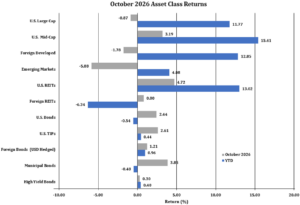
October was a tale of two markets. Early in the month, the S&P 500 hit a fresh record high on October 6. However, the month ended on a sour note. The S&P 500 declined -0.9% for the month with artificial intelligence (AI) and mega-cap growth stocks under late-month heavy selling pressure while defensive and value segments attracted inflows.
Throughout the month, investors weighed the viability of economic growth, persistent inflation, Federal Reserve (Fed) policy, corporate profitability, geopolitical unrest, and the potential overvaluation of AI-linked equities. The result was a market focused more on individual companies and sectors rather than a general broad-based preference for equity markets.
Foreign developed and emerging market (EM) equities fell in October by 1.8% and 5.9%, respectively. As noted above, investors became more skeptical about the enormous amount of capital being spent on AI infrastructure and whether those investments would generate adequate returns. That triggered selling in semiconductor and AI-linked stocks and affected Korea, Taiwan and other Asian markets with higher technology and semiconductor exposure. International weakness was not a broad-based rejection of non-U.S. equities but was more concentrated in AI/semiconductor-sensitive markets.
Fixed income performance positively reversed in October. Bond markets previously experienced a difficult September due to rising Treasury yields. Ten-year Treasury yields began October at an elevated level of 5.29%. However, yields gradually slid to 4.94% as investors’ concerns about interest rates waned somewhat, while confidence in the U.S. economy rose. As a result, U.S. bonds, as measured by the Bloomberg U.S. Aggregate Bond Index, gained 2.4% in October, recovering some of September’s loss.
In summary, October stock and bond markets were volatile with mixed signals from strong earnings, resilient economic growth and interest rate moderation offset by higher oil prices, Fed policy and U.S. mid-term election uncertainty.

U.S. Mid-Term Election Implications and Early November Market Volatility
Democrats won elections in both the U.S. House of Representatives and the Senate to significantly change the U.S. balance of political power. The margin of the Democrat sweep was, perhaps, more than expected. Since President Trump will remain in office for the next two years, there will more likely be policy gridlock as the President has veto power while Congress controls legislation, spending and Senate confirmations. Gridlock may replace some policy uncertainty which impacts market volatility.
AI investment is not likely to stop because of the election results. However, the Democratic sweep at the national level also carried over to the state and local level. AI projects are expected to face greater scrutiny and regulation and may delay or curtail the rapid recent development of data centers. AI capital investment uncertainty by investors was a major reason for the November 5th market drop which significantly impacted technology and semiconductor chip companies.
Early November Market Movements
What Happened — The Facts
On November 5, the Dow Jones Industrial Average dropped 1,833 points (3.44%), while the S&P 500 fell 4.35% and the Nasdaq Composite declined 5.52%. This marked the steepest single day drop for major U.S. stock indices since April 2025, when President Trump’s sweeping tariff announcements triggered global market turmoil. The catalyst was a sharp rotation out of mega-cap technology and AI-linked stocks. Selling pressure accelerated as investors reassessed lofty valuations of mega-cap tech giants following a series of corporate updates, alongside growing skepticism over when heavy corporate spending on AI would translate into meaningful profits. Semiconductors were at the center of the drop on November 5: the iShares Semiconductor ETF fell more than 12%, Nvidia declined roughly 9%, and Broadcom fell about 10%. That concentration matters because weakness in a relatively small group of very large companies can have an outsized impact on the headline indexes.
Perspective: The Year’s Gains Are Largely Intact
One difficult day does not erase a year of progress. Despite the November 5 losses, the S&P 500 has a total return of 8.4% in 2026. Also, through November 5, the Dow and the Nasdaq were up 8.6% and 5.1%, respectively. Volatility is a normal part of investing, and sharp single-day moves are not uncommon even in healthy bull markets. Importantly, the economic backdrop has not collapsed. At its October 28 meeting, the Fed said economic activity was expanding at a strong pace, consumer spending was resilient, productivity growth was strong and capital investment robust. That is an important distinction. Based on our research the market decline appears more related to valuation, positioning, and policy uncertainty than an abrupt deterioration in economic fundamentals.
What is Driving Volatility (Fear) — And Why It May Be Overblown
The dramatic sell-off reversed the previous day’s post-election rally, with technology and AI stocks bearing the brunt of investor anxiety over the Democrats’ sweeping victories. Traders pointed to worries that the Democratic wins in both chambers of Congress could bring tighter rules for data-center buildouts, a concern that spread from chipmakers to software and infrastructure names. At the same time, significant regulatory changes generally require a formal rulemaking process before implementation.
The Flight to Safety Signal — Bonds Are Doing Their Job
As investors sought safety in Treasury bonds amid the November 5 sell-off, Treasury prices rose and the benchmark 10-year yield fell to its lowest level since September 9, providing a tailwind for much of the bond market. For investors with diversified portfolios, this is a reminder that bonds and defensive assets can help cushion equity volatility — exactly why diversification matters.
Investment Takeaway
The biggest investment takeaway from the midterms is not that we should reposition portfolios around which party won. Divided government could mean less fiscal stimulus, potentially lower tariffs and a somewhat more predictable policy environment. If that contributes to slower inflation and a less aggressive Fed, it could be supportive for both stocks and bonds. At the same time, U.S. markets remain highly concentrated, particularly around the AI theme, so another important takeaway is to stay diversified across U.S. and international markets, fixed income and other sources of diversification rather than making a political bet.
Days like November 5 are uncomfortable but not unprecedented. A well-constructed, long-term portfolio is built to weather exactly this kind of volatility. JMG builds portfolios with corrections in mind. This also gives us the opportunity to rebalance in periods when markets fall sharply.
If you have any questions or wish to review your portfolio asset allocations, please consult your JMG Advisor.
Important Disclosure
Please remember that past performance may not be indicative of future results. Different types of investments involve varying degrees of risk, and there can be no assurance that the future performance of any specific investment, investment strategy, or product (including the investments and/or investment strategies recommended or undertaken by JMG Financial Group Ltd. (“JMG”), or any non-investment related content, made reference to directly or indirectly in this writing will be profitable, equal any corresponding indicated historical performance level(s), be suitable for your portfolio or individual situation, or prove successful.
This content is provided for educational purposes only. Due to various factors, including changing market conditions and/or applicable laws, the content may no longer be reflective of current opinions or positions. Moreover, you should not assume that any discussion or information contained in this writing serves as the receipt of, or as a substitute for, personalized investment advice from JMG. To the extent that a reader has any questions regarding the applicability of any specific issue discussed above to his/her individual situation, he/she is encouraged to consult with the professional advisor of his/her choosing. JMG is neither a law firm, nor a certified public accounting firm, and no portion of the content provided in this writing should be construed as legal or accounting advice.
A copy of JMG’s current written disclosure Brochure discussing our advisory services and fees is available upon request. If you are a JMG client, please remember to contact JMG, in writing, if there are any changes in your personal/financial situation or investment objectives for the purpose of reviewing/evaluating/revising our previous recommendations and/or services, or if you would like to impose, add, or to modify any reasonable restrictions to our investment advisory services. JMG shall continue to rely on the accuracy of information that you have provided.
To the extent provided in this writing, historical performance results for investment indices and/or categories have been provided for general comparison purposes only, and generally do not reflect the deduction of transaction and/or custodial charges, the deduction of an investment management fee, nor the impact of taxes, the incurrence of which would have the effect of decreasing historical performance results. It should not be assumed that your account holdings correspond directly to any comparative indices. Indices are not available for direct investment.
Market Segment (index representation) as follows: U.S. Large Cap (S&P Total Return); U.S. Mid-Cap (Russell Midcap Index Total Return); Foreign Developed (FTSE Developed Ex U.S. NR USD); Emerging Markets (FTSE Emerging NR USD); U.S. REITs (FTSE NAREIT Equity Total Return Index); Foreign REITs (FTSE EPRA/NAREIT Developed Real Estate Ex U.S. TR); U.S Bonds (Bloomberg US Aggregate Bond Index); U.S. TIPs (Bloomberg US Treasury Inflation-Linked Bond Index); Foreign Bond (USD Hedged) (Bloomberg Global Aggregate Ex US TR Hedged); Municipal Bonds (Bloomberg US Municipal Bond Index); High Yield Bonds (Bloomberg US Corporate High Yield Index).
Certain performance information presented herein is hypothetical and provided solely for illustrative and educational purposes. Hypothetical results do not represent the performance of any actual client account or portfolio and should not be interpreted as a prediction or guarantee of future results. The results are based on assumptions regarding interest-rate movements, market conditions, portfolio characteristics, and other factors that may not occur. Hypothetical performance does not reflect actual trading, liquidity constraints, investor behavior, taxes, investment advisory fees, transaction costs, custodial charges, or other expenses, the inclusion of which would reduce returns. Hypothetical performance has inherent limitations, including the benefit of hindsight, and actual results may differ materially. No representation is made that any investor will achieve results like those illustrated. All investing involves risk, including the possible loss of principal.