

Fixed Income 2026
INVESTMENT COMMITTEE COMMENTARY September 2026
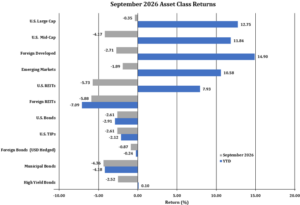
U.S. and global equity markets delivered generally negative results in September as investors balanced strong corporate earnings and continued enthusiasm for artificial intelligence (AI) against rising interest rates and geopolitical uncertainty. Large-cap technology and semiconductor companies were market leaders while more interest-rate-sensitive and cyclical sectors generally lagged. Outside the U.S., foreign and emerging-market equities fell primarily due to higher global interest rates, rising oil prices, inflation concerns, and expectations of tighter monetary policies outweighing otherwise solid economic and earnings results.
Fixed income markets experienced one of their most difficult months in recent years as government bond yields surged across major developed markets. Higher yields were driven by higher energy prices, persistent inflation concerns, strong economic data, continued budget deficits, and a more hawkish stance from central banks. Continued AI-related capital spending has also increased demand for capital, driving yields higher. Rates increased across the yield curve as the Federal Reserve raised its target rate by 0.25 percentage points in September, bringing the target range to 3.75%–4.00%. Also, the U.S. 10-year Treasury yield rose above 5%, reaching levels not seen since before the Global Financial Crisis. Rising real yields weighed on both Treasury and investment-grade bond prices, while credit spreads remained relatively stable due to healthy corporate balance sheets and continued economic expansion.
Global oil markets tightened considerably with prices increasing by roughly 30% over the third quarter. Renewed disruptions in the Middle East, constrained shipping through the Strait of Hormuz, falling inventories, and disruptions to Russian refineries pushed oil prices notably higher by mid-September. However, prices receded somewhat at the end of the month amid signs that some disrupted oil flows were returning. Higher crude oil prices affect transportation costs, fuel expenses, and business operating costs, which may impact the level of inflation.
In summary, September included investor uncertainties from disconcerting geopolitical headlines and related market volatility. But strong earnings and resilient economic growth partially offset the headwinds of higher oil prices, Fed rate hikes and rising Treasury yields.

Fixed Income – 2026
As a result of an accelerating rise in interest rates in September, it has been a challenging year for fixed income. This has been the result of multiple factors, including:
- Rising inflation due to energy disruptions in the Middle East and Russia.
- Continued budget deficits, especially in developed markets.
- Increased demand for capital due to the AI buildout.
- Continued economic growth.
While the impact of rising rates on fixed income portfolios has been frustrating, the trend towards higher rates is potentially a long-term positive for fixed income investors because higher rates support better returns for reinvested capital. Similarly, higher rates reduce interest rate sensitivity and provide a buffer against price volatility. Finally, fixed income continues to offer the potential to diversify equity portfolios.
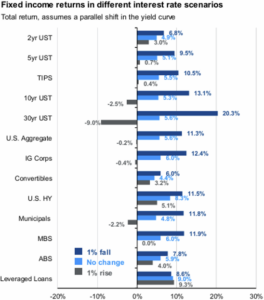
Today’s higher starting yields create a more favorable return profile than what investors experienced when yields were near zero. The following chart from J.P. Morgan reflects interest rate sensitivities of differing bond types in both increasing and decreasing interest rate environments. Strong positive returns to the right compare favorably to potential downside risks.

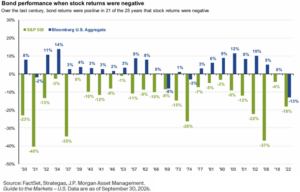
Why should bonds continue to be a strategic long-term investment in portfolios? The fixed income asset class has historically provided diversification. Generally, equities are bought for growth and high real (after inflation) return. However, with higher returns comes higher volatility in performance. The following chart shows that over the last 100 calendar years, equities had negative returns in 25 calendar years. However, fixed income bond performance was positive in 21 out of 25 years when equities declined. This illustrates why diversification matters in portfolio construction. The chart also shows that 1969 and 2022 were years when bonds fell along with equities and in these years, inflation was more difficult to navigate.
Investment implications – Fixed income remains an important component of investment portfolios. Higher starting yields have improved bonds’ prospective income and total-return potential, although continued geopolitical risks could lead to further near-term volatility.
Equities continue to have generally strong year-to-date performance. Still, powerful forces are supporting this year-to-date rally in the form of impressive economic growth and historically strong corporate earnings growth. These two substantial positives can offset macroeconomic headwinds and higher interest rates.
If you have any questions or wish to review your portfolio asset allocations, please consult your JMG Advisor.
Important Disclosure
Please remember that past performance may not be indicative of future results. Different types of investments involve varying degrees of risk, and there can be no assurance that the future performance of any specific investment, investment strategy, or product (including the investments and/or investment strategies recommended or undertaken by JMG Financial Group Ltd. (“JMG”), or any non-investment related content, made reference to directly or indirectly in this writing will be profitable, equal any corresponding indicated historical performance level(s), be suitable for your portfolio or individual situation, or prove successful.
This content is provided for educational purposes only. Due to various factors, including changing market conditions and/or applicable laws, the content may no longer be reflective of current opinions or positions. Moreover, you should not assume that any discussion or information contained in this writing serves as the receipt of, or as a substitute for, personalized investment advice from JMG. To the extent that a reader has any questions regarding the applicability of any specific issue discussed above to his/her individual situation, he/she is encouraged to consult with the professional advisor of his/her choosing. JMG is neither a law firm, nor a certified public accounting firm, and no portion of the content provided in this writing should be construed as legal or accounting advice.
A copy of JMG’s current written disclosure Brochure discussing our advisory services and fees is available upon request. If you are a JMG client, please remember to contact JMG, in writing, if there are any changes in your personal/financial situation or investment objectives for the purpose of reviewing/evaluating/revising our previous recommendations and/or services, or if you would like to impose, add, or to modify any reasonable restrictions to our investment advisory services. JMG shall continue to rely on the accuracy of information that you have provided.
To the extent provided in this writing, historical performance results for investment indices and/or categories have been provided for general comparison purposes only, and generally do not reflect the deduction of transaction and/or custodial charges, the deduction of an investment management fee, nor the impact of taxes, the incurrence of which would have the effect of decreasing historical performance results. It should not be assumed that your account holdings correspond directly to any comparative indices. Indices are not available for direct investment.
Market Segment (index representation) as follows: U.S. Large Cap (S&P Total Return); U.S. Mid-Cap (Russell Midcap Index Total Return); Foreign Developed (FTSE Developed Ex U.S. NR USD); Emerging Markets (FTSE Emerging NR USD); U.S. REITs (FTSE NAREIT Equity Total Return Index); Foreign REITs (FTSE EPRA/NAREIT Developed Real Estate Ex U.S. TR); U.S Bonds (Bloomberg US Aggregate Bond Index); U.S. TIPs (Bloomberg US Treasury Inflation-Linked Bond Index); Foreign Bond (USD Hedged) (Bloomberg Global Aggregate Ex US TR Hedged); Municipal Bonds (Bloomberg US Municipal Bond Index); High Yield Bonds (Bloomberg US Corporate High Yield Index).
Certain performance information presented herein is hypothetical and provided solely for illustrative and educational purposes. Hypothetical results do not represent the performance of any actual client account or portfolio and should not be interpreted as a prediction or guarantee of future results. The results are based on assumptions regarding interest-rate movements, market conditions, portfolio characteristics, and other factors that may not occur. Hypothetical performance does not reflect actual trading, liquidity constraints, investor behavior, taxes, investment advisory fees, transaction costs, custodial charges, or other expenses, the inclusion of which would reduce returns. Hypothetical performance has inherent limitations, including the benefit of hindsight, and actual results may differ materially. No representation is made that any investor will achieve results like those illustrated. All investing involves risk, including the possible loss of principal.