

Mid-Year Commentary
INVESTMENT COMMITTEE COMMENTARY June 2026
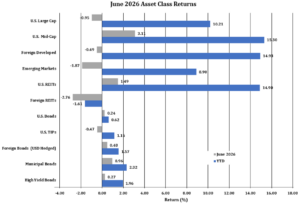
After strong U.S. stock market returns and record highs in April and May due to Iran War de-escalation, strong corporate earnings, and resilient consumer spending, June stock performance was more mixed.
The S&P 500 fell 1% in June. In contrast, U.S. mid-cap stocks gained 3.1% for the month. Foreign developed and emerging market equities fell 0.5% and 1.9%, respectively, but they continue to have solid positive returns through June.
In early June, the stock rally continued thanks initially to reported progress on a U.S./Iran ceasefire agreement, which was eventually signed by President Trump and Iranian leaders in mid-June. Anticipation for the SpaceX IPO (the largest IPO in history) also helped to further support the tech sector and AI-linked investments. The S&P 500 hit another new all-time high mid-month. However, also in mid-June, investors received a surprise from new Federal Reserve (Fed) Chairman Kevin Warsh. While the Fed met expectations and made no change to interest rates in June, the meeting statement and Warsh press conference were viewed as “hawkish”. Chances for a Fed interest rate hike later this year rose sharply. That deviation from previous Fed policy expectations caused some market volatility. However, stocks generally proved resilient as falling oil prices (which dropped back to pre-war levels) led investors to believe the current inflation spike will be temporary.
Inflationary pressures, which stabilized somewhat in the first quarter, made a supply-driven return in the second quarter. Driven by rising energy prices, the Consumer Price Index spiked to an estimated annualized average of 6.0% for the quarter, while core prices hovered around 3.2%.
According to FactSet, following a strong first quarter in which S&P 500 companies posted 28.6% earnings growth (the highest since 2021), corporate profits are expected to carry strong momentum into the second quarter. For the second quarter, analysts are projecting a year-over-year growth rate of 20.6%-21.3% for the S&P 500. Corporate America remains resilient despite market anxiety surrounding sticky inflation and a potential Federal Reserve interest rate hike.
Bond prices in June rose slightly, as the yield on 10-year Treasuries was roughly flat, moving from 4.45% to 4.44%. The Bloomberg U.S. Aggregate Bond Index (AGG) posted a 0.2% return for the month. The municipal bond sub-index gained 1.0% in June. However, Treasury Inflation-Protected Securities (TIPS) fell by 0.5% as TIPS had more sensitivity to higher 10-year real (after inflation) Treasury yields. Fixed income indices have generally posted positive performance so far in 2026.

Mid-Year Commentary
As in 2025, stocks proved resilient in the first half of this year despite several macro-economic surprises. To that point, investors confronted numerous market surprises over the first six months of 2026. These included the U.S./Iran War, a spike in oil prices to multi-year highs, a rebound in inflation (which caused rate hike expectations to replace rate cut hopes) and uncertainty related to the broad future profitability of artificial intelligence (AI) capital spending. But while those surprises caused temporary bouts of market volatility (with the worst coming in March at the onset of the U.S./Iran war), they were largely offset by foundational bull market metrics: strong earnings and solid economic growth.
The first quarter earnings season was much stronger than expected, and the earnings gains were led by AI-linked tech stocks such as Nvidia, Micron and others. More broadly, a majority of companies also reported better-than-expected revenue and earnings, and such strong corporate performance helped offset macroeconomic uncertainty.
Economic growth, meanwhile, pushed back consistently on fears of stagflation following the war-driven spike in oil prices. Inflation metrics and prices rose but economic growth never wavered, as virtually all economic indicators from the labor market, manufacturing and service sectors showed solid activity. Also, consumer debt payments as a percent of income remain relatively low with overall delinquencies at moderate levels, similar to the pre-covid period. However, consumer credit card trends appear to be weakening.
AI enthusiasm remained a key driver of the 2026 stock rally, as numerous large tech companies reaffirmed their commitment to spend hundreds of billions of dollars on data center and AI infrastructure. The capital investment gave investors continued confidence in the future of AI and provided a broad economic boost, as these massive tech companies spend across the economy to build out data centers and other AI infrastructure.
Third Quarter Market Outlook
While the market and economy were again impressively resilient in the first half of 2026, we continue to monitor several factors that may be risks to this bull market continuing as we head into the second half of the year.
Artificial Intelligence (AI) – AI remains the main factor on the future of the global economy and investment markets. Blackstone reports that the hyperscale companies, massive-scale cloud providers that build and manage data centers to offer global computing, storage, and networking resources, are committed to capital investment in excess of $5 trillion through 2030. Generative AI usage was about 48 billion hours in 2025 compared to 13 billion hours in 2024. Energy is critical. AI searches are ten times more energy intensive than traditional searches and ten thousand times more intensive for video generation (McKinsey). Corporate adoption of AI is in various stages and depends on the industry.
Other Factors Driving Markets
The investment markets remain resilient to the following factors.
- Geopolitical Factors – Material Uncertainties – The U.S./Iran War continues, and much can happen to reverse the recent de-escalation of the war. No one knows what may happen other than investors seem to have been looking through near-term issues and expecting hostilities to continue to cool or pause. The Ukraine / Russia War also continues in the region. In the U.S. mid-term elections are approaching and the results could bring material policy changes.
- Corporate Earnings and Gross Domestic Product (GDP) Growth – Earnings, GDP growth, and consumer spending are uneven across countries, industries, and consumers. Broadly, corporate balance sheets and fundamentals remain healthy. However, lower income and “paycheck-to-paycheck” households are facing difficulties in covering stubborn inflation and consumer spending from this portion of the population is under more stress.
- Inflation – The Producer Price Index (PPI) tracks the prices of intermediate goods (components that go into final goods products that consumers purchase from their favorite retailers). Notably, measures of intermediate goods prices have risen for the last three months and the percentage of intermediate goods with rising prices has risen sharply the last two months. The concern is that producer price increases generally lead consumer prices (CPI) and the recent surge in producer prices does not bode well for consumers. Policy makers and the Fed are monitoring near-term inflation readings and hoping for inflation to moderate and cool sooner rather than later. The inflation outlook will have a direct impact on Fed policy and the degree of future interest rate hikes.
- Employment – Similar to corporate earnings, employment has been uneven. The headline jobs numbers indicate that employment is expanding consistent with a late-stage U.S. economic cycle. Reviewing the underlying jobs data below the headlines, economic research firm RDLB, Inc. reported that 677,000 private sector jobs were created in the last year. However, this increase was entirely due to jobs in healthcare and leisure / hospitality with increases of 698,000 jobs. Therefore, the jobs gains have been lopsided even as the official unemployment rate has been flat at about 4.3%.
- Capital Markets – The SpaceX IPO was the big capital markets event in the second quarter. Blackstone reports that U.S. IPO volume has increased 186% year-over-year in 2026. Further, U.S. mergers and acquisitions volume has risen 64%, year-over-year. Following SpaceX, upcoming IPOs are planned for artificial intelligence companies, Anthropic and OpenAI. In related capital trends, the hyperscalers are trending toward significantly higher debt levels needed to fund AI infrastructure.
Many of the “megatrend” factors influencing current markets are in their early stages with still uncertain future outcomes. Therefore, the exposure of the entire economy and market to continued AI investment remains a source of concern. Massive AI infrastructure investment is helping to power the economy, but if the companies spending that money begin to doubt the return on investment of AI infrastructure investment, this could reduce spending and that would be an economic negative that impacts markets.
Summary
The second half of 2026 begins with a strong market: Earnings growth is above historical averages, economic growth is solid and AI enthusiasm remains as boisterous as ever. However, risks remain in the form of higher inflation, potential rate hikes and potential vulnerability to AI infrastructure spending.
As always, we emphasize diversification, disciplined rebalancing, and alignment with long-term financial objectives rather than short-term market movements. If you have any questions or wish to review your portfolio asset allocations, please consult your JMG Advisor.
Important Disclosure
Please remember that past performance may not be indicative of future results. Different types of investments involve varying degrees of risk, and there can be no assurance that the future performance of any specific investment, investment strategy, or product (including the investments and/or investment strategies recommended or undertaken by JMG Financial Group Ltd. (“JMG”), or any non-investment related content, made reference to directly or indirectly in this writing will be profitable, equal any corresponding indicated historical performance level(s), be suitable for your portfolio or individual situation, or prove successful.
This content is provided for educational purposes only. Due to various factors, including changing market conditions and/or applicable laws, the content may no longer be reflective of current opinions or positions. Moreover, you should not assume that any discussion or information contained in this writing serves as the receipt of, or as a substitute for, personalized investment advice from JMG. To the extent that a reader has any questions regarding the applicability of any specific issue discussed above to his/her individual situation, he/she is encouraged to consult with the professional advisor of his/her choosing. JMG is neither a law firm, nor a certified public accounting firm, and no portion of the content provided in this writing should be construed as legal or accounting advice.
A copy of JMG’s current written disclosure Brochure discussing our advisory services and fees is available upon request. If you are a JMG client, please remember to contact JMG, in writing, if there are any changes in your personal/financial situation or investment objectives for the purpose of reviewing/evaluating/revising our previous recommendations and/or services, or if you would like to impose, add, or to modify any reasonable restrictions to our investment advisory services. JMG shall continue to rely on the accuracy of information that you have provided.
To the extent provided in this writing, historical performance results for investment indices and/or categories have been provided for general comparison purposes only, and generally do not reflect the deduction of transaction and/or custodial charges, the deduction of an investment management fee, nor the impact of taxes, the incurrence of which would have the effect of decreasing historical performance results. It should not be assumed that your account holdings correspond directly to any comparative indices. Indices are not available for direct investment.
Market Segment (index representation) as follows: U.S. Large Cap (S&P Total Return); U.S. Mid-Cap (Russell Midcap Index Total Return); Foreign Developed (FTSE Developed Ex U.S. NR USD); Emerging Markets (FTSE Emerging NR USD); U.S. REITs (FTSE NAREIT Equity Total Return Index); Foreign REITs (FTSE EPRA/NAREIT Developed Real Estate Ex U.S. TR); U.S Bonds (Bloomberg US Aggregate Bond Index); U.S. TIPs (Bloomberg US Treasury Inflation-Linked Bond Index); Foreign Bond (USD Hedged) (Bloomberg Global Aggregate Ex US TR Hedged); Municipal Bonds (Bloomberg US Municipal Bond Index); High Yield Bonds (Bloomberg US Corporate High Yield Index).