

Exchange Traded Funds (ETFs) and IPOs
INVESTMENT COMMITTEE COMMENTARY May 2026
The U.S. stock market continued its April momentum through May. Equity indexes posted notable monthly gains, with several indexes reaching historic highs. The May rally was largely dominated by the information technology sector, particularly artificial intelligence (AI) company stocks. Strong first quarter corporate earnings performance helped support Wall Street’s May stock market surge. The S&P 500 and the NASDAQ each set new records in May.
While equities rose, the bond market exhibited anxiety over inflation and fiscal sustainability. The yield on 10-year Treasuries ranged between 4.36% and 4.67% during the month. The 10-year yields reached their highest levels since July 2025, evidencing a broad repricing on inflationary pressures, elevated energy prices, and uncertainty surrounding Federal Reserve (Fed) leadership and policy direction. Yields on two-year notes rose to around 4% with lowered expectations of Fed interest rate cuts for the remainder of 2026, which has resulted in an upwardly sloping yield curve for the first time since mid-2022.
Inflation data showed renewed upward pressure in May. Both the personal consumption expenditures (PCE) price index (the preferred inflation indicator of the Fed) and the Consumer Price Index rose 3.8% since last April, well above the Fed’s 2.0% target. Prices at the wholesale level increased by 6.0% over the past 12 months, the fastest pace of growth since 2022.
In addition to price pressures, the economy showed signs of slowing. First quarter gross domestic product was revised downward to an annualized rate of 1.6% from an earlier estimate of 2.0%. While business and government spending provided some cushion, consumer spending decelerated from 1.9% to 1.4%. Slowing wage growth and higher fuel costs helped weaken consumer spending and disposable income, which fell to its lowest level since February 2025.
Despite these signs of a slowing economy, corporate earnings in the first quarter showed strong performance from S&P 500 companies, marking the fastest earnings growth since 2021. Earnings growth surged to 28.4% year-over-year, according to FactSet, with 84% of S&P 500 companies beating earnings per share (EPS) estimates. All the “Magnificent 7” companies beat EPS expectations, with earnings exceeding estimates of 32.5%, roughly twice the overall S&P 500 average.
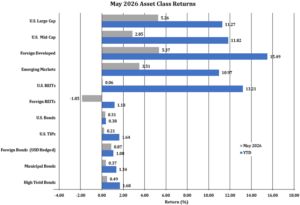
The S&P 500 rose 5.3% in May and is up 11.3% year-to-date through May. Foreign developed and emerging market equities also rose 5.4% and 3.5%, respectively, and also have double digit returns through May.
Bonds had modest positive performance in May. Yields are reacting to elevated inflation coupled with strong growth metrics. The Bloomberg U.S. Aggregate Bond Index (AGG) gained 0.3% for the month. Other bond sub-indexes had positive performance in May including high yield bonds, municipal bonds and U.S. Treasury Inflation Protected Securities (TIPS).

Exchange Traded Funds (ETFs) and IPOs
The recent SpaceX IPO has raised questions about how indexes will treat IPOs and what the investment implications might be for investors.
U.S exchange-traded funds (ETFs) are common investment vehicles for stocks, bonds, and other assets as they can bring ease of trading, low cost, tax efficiency, and liquidity to portfolios. There has been a proliferation of ETF launches providing a wide variety of investment choices.
Focusing on equity ETFs, there are roughly 2,000 ETFs which track U.S. stock indices and now amount to over $10 trillion. By far, the largest ETFs track the S&P 500 followed by the NASDAQ 100 and the CRSP U.S. Total Market Index.
Different index methodologies lead to different stock allocations. When observing the different performance of the indexes and especially when investing in ETFs based on different indexes, it is essential to understand the methodologies of each index and what factors drive its performance.
- As an example, the S&P 500 is a market capitalization weighted index with the companies with the largest market value assigned higher weightings. As a result, the seven largest companies, often referred to as the Magnificent 7 stocks (GOOG/GOOGL, AMZN, AAPL, META, MSFT, NVDA, TSLA) account for a high concentration of the S&P 500, currently near 35%.
- The NASDAQ 100 has a more limited universe of companies, and as a result the Magnificent 7 represents an even higher percent of over 40%.
- Similarly, many are surprised that two companies (Goldman Sachs and Caterpillar) account for about 24% of the Dow Jones Industrial Average (DJIA). The reason is in the index methodology as the DJIA is a price-weighted index with a limited number of constituents. The companies with the highest price per share are assigned a larger index weighting. (The DJIA was created on May 26, 1896, with 12 companies and expanded to 30 companies in 1928, with the goal of representing the American economy, rather than serve as a measure of the overall stock market. Market Cap weighted indexes came later. The DJIA remains a familiar index to investors with performance reported daily in the media.)
Initial Public Offerings
Recently and in the upcoming months, several large and important initial public offerings (IPOs) will take place (SpaceX, Anthropic, OpenAI). As an example, the recent SpaceX IPO valued the company at about $1.75 trillion, making it one of the largest global public companies.
At such a valuation, SpaceX could be a top ten S&P 500 constituent as well as a NASDAQ 100 constituent, on a fully market cap-weighted basis. However, indexes typically use a more modest weighting methodology, limiting the weight to shares trading in public markets, sometimes called the “float.” In the case of SpaceX, the initial float from the IPO is $75B, less than 5% of the company’s shares. The remaining shares will become available to trade as lockups on existing shareholders expire over about a 12-month period, with Elon Musk’s shares becoming eligible to trade in June 2027 and some institutions (e.g. Alphabet/Google) delayed until August 2027. Indexes will follow their own methodologies for including additional shares being traded, typically assessing the market quarterly.
From an index standpoint, the release of these shares to the public markets will progressively add the company to broad U.S. benchmark indexes by diluting existing company weights. Each index has different methodologies as to the timing of index inclusion. This IPO is unusual due to its size and number of restricted investors. There is some push to “fast track” these companies into the indices. Roughly, listing the fastest to slowest inclusion in the indices, are:
- CRSP (1 week),
- FTSE Russell (5 trading days)
- NASDAQ (15 trading days)
- MSCI (1-3 months) and
- S&P Dow Jones S&P 500 (12 months, but possible 6 months with rules change).
All of this highlights the challenges that index fund managers face while they seek to track the indexes they have been assigned. Indexes change their constituents regularly, and portfolio managers have many techniques to smooth these transitions, including trading techniques as well as the use of derivatives to ensure they maintain the correct exposures. Due to the size of SpaceX and other potential AI related companies, these techniques are going to be put to the test and possibly new techniques will be developed.
For our part, due to the different approaches taken by the index providers, we anticipate some dispersion of returns between indexes (and hence funds) due to this event. We do not think that these differences are predictable in advance. That said, we are confident in the indexes and managers we have selected to represent the asset classes in our investment process, and we believe that the corresponding investments will contribute to our client’s wealth over the longer term.
While equity markets have reached new highs, underlying economic signals remain mixed. We continue to emphasize diversification, disciplined rebalancing, and alignment with long-term financial objectives rather than short-term market movements. If you have any questions or wish to review your portfolio asset allocations, please consult your JMG Advisor.
Important Disclosure
Please remember that past performance may not be indicative of future results. Different types of investments involve varying degrees of risk, and there can be no assurance that the future performance of any specific investment, investment strategy, or product (including the investments and/or investment strategies recommended or undertaken by JMG Financial Group Ltd. (“JMG”), or any non-investment related content, made reference to directly or indirectly in this writing will be profitable, equal any corresponding indicated historical performance level(s), be suitable for your portfolio or individual situation, or prove successful.
This content is provided for educational purposes only. Due to various factors, including changing market conditions and/or applicable laws, the content may no longer be reflective of current opinions or positions. Moreover, you should not assume that any discussion or information contained in this writing serves as the receipt of, or as a substitute for, personalized investment advice from JMG. To the extent that a reader has any questions regarding the applicability of any specific issue discussed above to his/her individual situation, he/she is encouraged to consult with the professional advisor of his/her choosing. JMG is neither a law firm, nor a certified public accounting firm, and no portion of the content provided in this writing should be construed as legal or accounting advice.
A copy of JMG’s current written disclosure Brochure discussing our advisory services and fees is available upon request. If you are a JMG client, please remember to contact JMG, in writing, if there are any changes in your personal/financial situation or investment objectives for the purpose of reviewing/evaluating/revising our previous recommendations and/or services, or if you would like to impose, add, or to modify any reasonable restrictions to our investment advisory services. JMG shall continue to rely on the accuracy of information that you have provided.
To the extent provided in this writing, historical performance results for investment indices and/or categories have been provided for general comparison purposes only, and generally do not reflect the deduction of transaction and/or custodial charges, the deduction of an investment management fee, nor the impact of taxes, the incurrence of which would have the effect of decreasing historical performance results. It should not be assumed that your account holdings correspond directly to any comparative indices. Indices are not available for direct investment.
Market Segment (index representation) as follows: U.S. Large Cap (S&P Total Return); U.S. Mid-Cap (Russell Midcap Index Total Return); Foreign Developed (FTSE Developed Ex U.S. NR USD); Emerging Markets (FTSE Emerging NR USD); U.S. REITs (FTSE NAREIT Equity Total Return Index); Foreign REITs (FTSE EPRA/NAREIT Developed Real Estate Ex U.S. TR); U.S Bonds (Bloomberg US Aggregate Bond Index); U.S. TIPs (Bloomberg US Treasury Inflation-Linked Bond Index); Foreign Bond (USD Hedged) (Bloomberg Global Aggregate Ex US TR Hedged); Municipal Bonds (Bloomberg US Municipal Bond Index); High Yield Bonds (Bloomberg US Corporate High Yield Index).