

Market Rotation or “Sell America”?
INVESTMENT COMMITTEE COMMENTARY January 2026
The U.S. stock market delivered strong performance to kick off 2026. Market indexes reached record-setting levels with the S&P 500 surpassing the 7,000 threshold for the first time in its history. The stock market continued to reflect the rotation from large cap technology stocks to the broader market as smaller capitalization stocks outperformed.
January continued trends we had seen in 2025, reflecting both the strengths and vulnerabilities in the U.S. economy. The combination of fiscal stimulus, resilient corporate earnings, and technological innovation provided avenues for growth, but the headwinds from tariffs, a cooling labor market, and persistent inflation signaled a more challenging road ahead. Entering February, investor sentiment remained cautiously optimistic even with the higher degree of economic and geopolitical uncertainties.
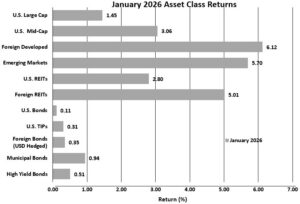
The S&P 500 rose 1.5% in January following last year’s strong performance of 17.9%. Foreign developed and emerging market equities rose 6.1% and 5.7%, respectively, in January, building on very strong 2025 returns of 34.2% and 26.0%.
International equity markets opened the year higher, as European equities also hit record highs. European investors mostly shrugged off geopolitical tensions, such as U.S. military involvement in Venezuela and tariff threats related to Greenland. Asian markets saw a heavy influx of capital and record-setting index returns though performance varied across major countries.
Bonds had modest positive performance in January as 10-year Treasury yields rose from 4.18% to 4.26%. The Bloomberg U.S. Aggregate Bond Index (AGG) gained 0.1% for the month. Other bond sub-indexes also had positive performance. Notably, municipal bonds gained 0.9% for the month.
![]()
Market Rotation or “Sell America”?
The asset class returns over the past year shows investors rotating away from U.S. large cap stocks and toward other “diversifying asset classes” such as smaller cap U.S. stocks, international stocks and real estate investment trusts (REITs). January continued this trend with solid performance from these areas.
Since World War II, the U.S. dollar has been the global reserve currency. There are many reasons for this, including the political dominance of the U.S., the strength of the U.S. economy and the depth, breadth, and liquidity of U.S. markets. For more than a decade, investors have generally favored U.S. equity investments and treasury bonds. The U.S economy is the largest in the world with strong consumers and cutting-edge innovation. Foreigners also invest in the U.S. for profit and diversification to have exposure to a broad range of sectors and industries beyond what might be available in their home countries.
The following chart from Ned Davis Research shows how U.S. equities as a percentage of global equities market value have increased (the blue section) over the last 15 years. This result is due to the confidence of global investors in American markets. As a result, valuations have risen, yet investors have continued to pay a premium for access to American markets.
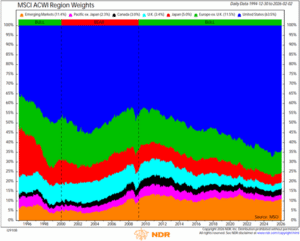
As the U.S. administration has been implementing a shift in U.S. foreign relations, some have suggested there is reason for concern. Among these are a falling U.S. dollar, rising gold prices, and foreign central banks shifting away from the dollar. In response, investors appear to be moving more of their U.S. stock and bond assets to foreign and emerging market assets or gold. Some have called this a “sell America” trade, arguing that these factors could cause the dollar to lose its reserve currency status.
We believe capital asset flows are adapting to the current economic and market environment. Markets are rebalancing and we think it unlikely the U.S. economy or markets are heading toward a catastrophic outcome. While the U.S. Dollar Index (DXY) is down over 10% from its peak and fell from about 99 to 97 in the last two weeks of January, these valuations are well within the dollar’s broad historical range (generally 80 to 120).
Concluding Comments
While these trends are worth monitoring, investors should maintain well diversified portfolios with material U.S. and non-U.S. exposure. We believe the core takeaway is clear: Stay diversified through the investment plan designed to meet your financial objectives, avoid reacting to headlines and maintain a long-term perspective. Consider the following.
- The U.S. continues to demonstrate durable strengths including a healthy consumer base, deep and liquid capital markets, technological innovation including AI investment and energy independence. These features should continue to attract global capital.
- The weaker dollar has not materially affected stock prices. U.S. Treasury yields have traded in bands that are not extreme. A weaker dollar makes imports more expensive but favors U.S. exporters. The U.S. dollar had been strong until the last year and a modest, orderly decline could be positive.
- President Trump favors what some call a “run hot” economic policy that prioritizes U.S. economic growth while accepting a weaker dollar, a higher than neutral inflation rate, and weakening employment statistics.
- We will continue to monitor Federal Reserve policies with expectations toward 2026 interest rate cuts. The President has nominated Kevin Warsh for Fed Chair, and he is broadly expected to maintain Fed independence.
- JMG recommends asset allocations that are global but with a U.S. bias. Of note, the foreign and emerging market equities portions of our portfolios benefit from a falling U.S. dollar, providing a natural hedge within client portfolios.
We continue to diligently monitor the investment environment and the opportunities and risks that may impact recommended allocations.
If you have any questions, please consult your JMG Advisor.
Important Disclosure
Please remember that past performance may not be indicative of future results. Different types of investments involve varying degrees of risk, and there can be no assurance that the future performance of any specific investment, investment strategy, or product (including the investments and/or investment strategies recommended or undertaken by JMG Financial Group Ltd. (“JMG”), or any non-investment related content, made reference to directly or indirectly in this writing will be profitable, equal any corresponding indicated historical performance level(s), be suitable for your portfolio or individual situation, or prove successful. Due to various factors, including changing market conditions and/or applicable laws, the content may no longer be reflective of current opinions or positions. Moreover, you should not assume that any discussion or information contained in this writing serves as the receipt of, or as a substitute for, personalized investment advice from JMG. To the extent that a reader has any questions regarding the applicability of any specific issue discussed above to his/her individual situation, he/she is encouraged to consult with the professional advisor of his/her choosing. JMG is neither a law firm, nor a certified public accounting firm, and no portion of the content provided in this writing should be construed as legal or accounting advice. A copy of JMG’s current written disclosure Brochure discussing our advisory services and fees is available upon request. If you are a JMG client, please remember to contact JMG, in writing, if there are any changes in your personal/financial situation or investment objectives for the purpose of reviewing/evaluating/revising our previous recommendations and/or services, or if you would like to impose, add, or to modify any reasonable restrictions to our investment advisory services. JMG shall continue to rely on the accuracy of information that you have provided.
To the extent provided in this writing, historical performance results for investment indices and/or categories have been provided for general comparison purposes only, and generally do not reflect the deduction of transaction and/or custodial charges, the deduction of an investment management fee, nor the impact of taxes, the incurrence of which would have the effect of decreasing historical performance results. It should not be assumed that your account holdings correspond directly to any comparative indices. Indices are not available for direct investment.
Market Segment (index representation) as follows: U.S. Large Cap (S&P Total Return); U.S. Mid-Cap (Russell Midcap Index Total Return); Foreign Developed (FTSE Developed Ex U.S. NR USD); Emerging Markets (FTSE Emerging NR USD); U.S. REITs (FTSE NAREIT Equity Total Return Index); Foreign REITs (FTSE EPRA/NAREIT Developed Real Estate Ex U.S. TR); U.S Bonds (Bloomberg US Aggregate Bond Index); U.S. TIPs (Bloomberg US Treasury Inflation-Linked Bond Index); Foreign Bond (USD Hedged) (Bloomberg Global Aggregate Ex US TR Hedged); Municipal Bonds (Bloomberg US Municipal Bond Index); High Yield Bonds (Bloomberg US Corporate High Yield Index).