

Why Did Stocks Pull Back in April?
INVESTMENT COMMITTEE COMMENTARY April 2024
Stocks ended April lower as benchmark indices endured their first downturn in several months. Throughout April, investors had to factor in the Federal Reserve’s (Fed) apparent intent to hold interest rates at a two-decade high, the track of inflation, and geopolitical risks from the escalating wars in the Middle East and Ukraine. With April’s decline, the S&P 500 ends a streak of five straight monthly gains. Consumer confidence fell in April to its lowest level since 2022. While the labor market continued to support job growth, labor costs increased the most in a year, driven higher by wage pressures that are helping to push inflation higher.
Inflation data showed price pressures continued to rise in March, with the Consumer Price Index (CPI) rising 3.5% for the 12 months ended in March (3.2% for the year ended in February), while the Personal Consumption Expenditures Price Index increased 0.2% to 2.7% for the year ended in March. Consumer spending slowed more than expected, coming in at a 2.5% increase in the first quarter compared to 3.3% in the fourth quarter. Spending on services rose 4.0% in the first quarter, following a 3.4% increase in the previous period.
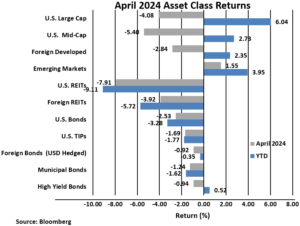
The S&P 500 fell 4.1% in April. Reflecting a modest change in investor sentiment, foreign developed and emerging markets equities outperformed U.S. stocks in April. Foreign developed stocks dropped by 2.8% while emerging market equities gained 1.6%. Interest rate sensitive U.S. REITs fell 7.9% as the yield on 10-year Treasuries hit its highest level since October.
Bond prices fell in April as the yield on 10-year Treasuries rose sharply from 4.20% to 4.69%. The Bloomberg U.S. Aggregate Bond Index declined 2.5% during the month. Other bond sub-indexes also fell in April and are lower for the year; however, high yield bonds are up modestly in 2024 at 0.5%.
Why Did Stocks Pull Back in April?
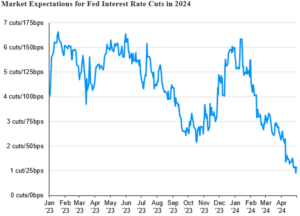
Coming into 2024, investors were optimistic in their views on economic growth, inflation, Fed rate cuts and corporate earnings, especially from Artificial Intelligence (AI) influences. April economic data was underwhelming, but not horrible. Importantly, inflation metrics were higher than expected. As a result, the Fed did not reduce interest rates as early as investors had hoped. Sticky inflation is not confirming “sustained and sustainable” progress toward the Fed’s 2% inflation target.
The following chart shows how quickly market expectations for interest rate cuts in 2024 have fallen. Such rate cuts would be expected to support a continued stock market rally. Instead, expectations for rate cuts moved from six cuts in 2024 to one or two cuts.
![]()
The markets are now digesting the “higher for longer” interest rate policy approach of the Fed. Economic growth remains solid and while there was some disappointment with first quarter GDP coming in at 1.6%, the economy still has positive momentum.
To summarize, the fundamentals for this market cycle (GDP growth, inflation, Fed rate cuts, and corporate earnings) remain fair, but the positive expectations that investors brought into 2024 have been muted, particularly by expectations on interest rate cuts.
If you have any questions, please consult your JMG Advisor.
Important Disclosure
Please remember that past performance may not be indicative of future results. Different types of investments involve varying degrees of risk, and there can be no assurance that the future performance of any specific investment, investment strategy, or product (including the investments and/or investment strategies recommended or undertaken by JMG Financial Group Ltd. (“JMG”), or any non-investment related content, made reference to directly or indirectly in this writing will be profitable, equal any corresponding indicated historical performance level(s), be suitable for your portfolio or individual situation, or prove successful. Due to various factors, including changing market conditions and/or applicable laws, the content may no longer be reflective of current opinions or positions. Moreover, you should not assume that any discussion or information contained in this writing serves as the receipt of, or as a substitute for, personalized investment advice from JMG. To the extent that a reader has any questions regarding the applicability of any specific issue discussed above to his/her individual situation, he/she is encouraged to consult with the professional advisor of his/her choosing. JMG is neither a law firm, nor a certified public accounting firm, and no portion of the content provided in this writing should be construed as legal or accounting advice. A copy of JMG’s current written disclosure Brochure discussing our advisory services and fees is available upon request. If you are a JMG client, please remember to contact JMG, in writing, if there are any changes in your personal/financial situation or investment objectives for the purpose of reviewing/evaluating/revising our previous recommendations and/or services, or if you would like to impose, add, or to modify any reasonable restrictions to our investment advisory services. JMG shall continue to rely on the accuracy of information that you have provided.
To the extent provided in this writing, historical performance results for investment indices and/or categories have been provided for general comparison purposes only, and generally do not reflect the deduction of transaction and/or custodial charges, the deduction of an investment management fee, nor the impact of taxes, the incurrence of which would have the effect of decreasing historical performance results. It should not be assumed that your account holdings correspond directly to any comparative indices. Indices are not available for direct investment.
Market Segment (index representation) as follows: U.S. Large Cap (S&P Total Return); U.S. Mid-Cap (Russell Midcap Index Total Return); Foreign Developed (FTSE Developed Ex U.S. NR USD); Emerging Markets (FTSE Emerging NR USD); U.S. REITs (FTSE NAREIT Equity Total Return Index); Foreign REITs (FTSE EPRA/NAREIT Developed Real Estate Ex U.S. TR); U.S Bonds (Bloomberg US Aggregate Bond Index); U.S. TIPs (Bloomberg US Treasury Inflation-Linked Bond Index); Foreign Bond (USD Hedged) (Bloomberg Global Aggregate Ex US TR Hedged); Municipal Bonds (Bloomberg US Municipal Bond Index); High Yield Bonds (Bloomberg US Corporate High Yield Index).