

The Risk of Being Out of the Market
INVESTMENT COMMITTEE COMMENTARY May 2022
Bearish sentiment seemed to diminish in May. A late month surge in stock performance was a welcome change after weeks of market drawdowns on continuing worries of inflation, rising interest rates and the war in Ukraine. It is too soon to conclude that the 2022 market decline has reached a bottom. However, we are seeing improved volatility statistics as measured by the trend in the VIX Index. As the S&P 500 reached the latest lows, net outflows from equity mutual funds and ETFs declined, a sign that selling pressures are abating.
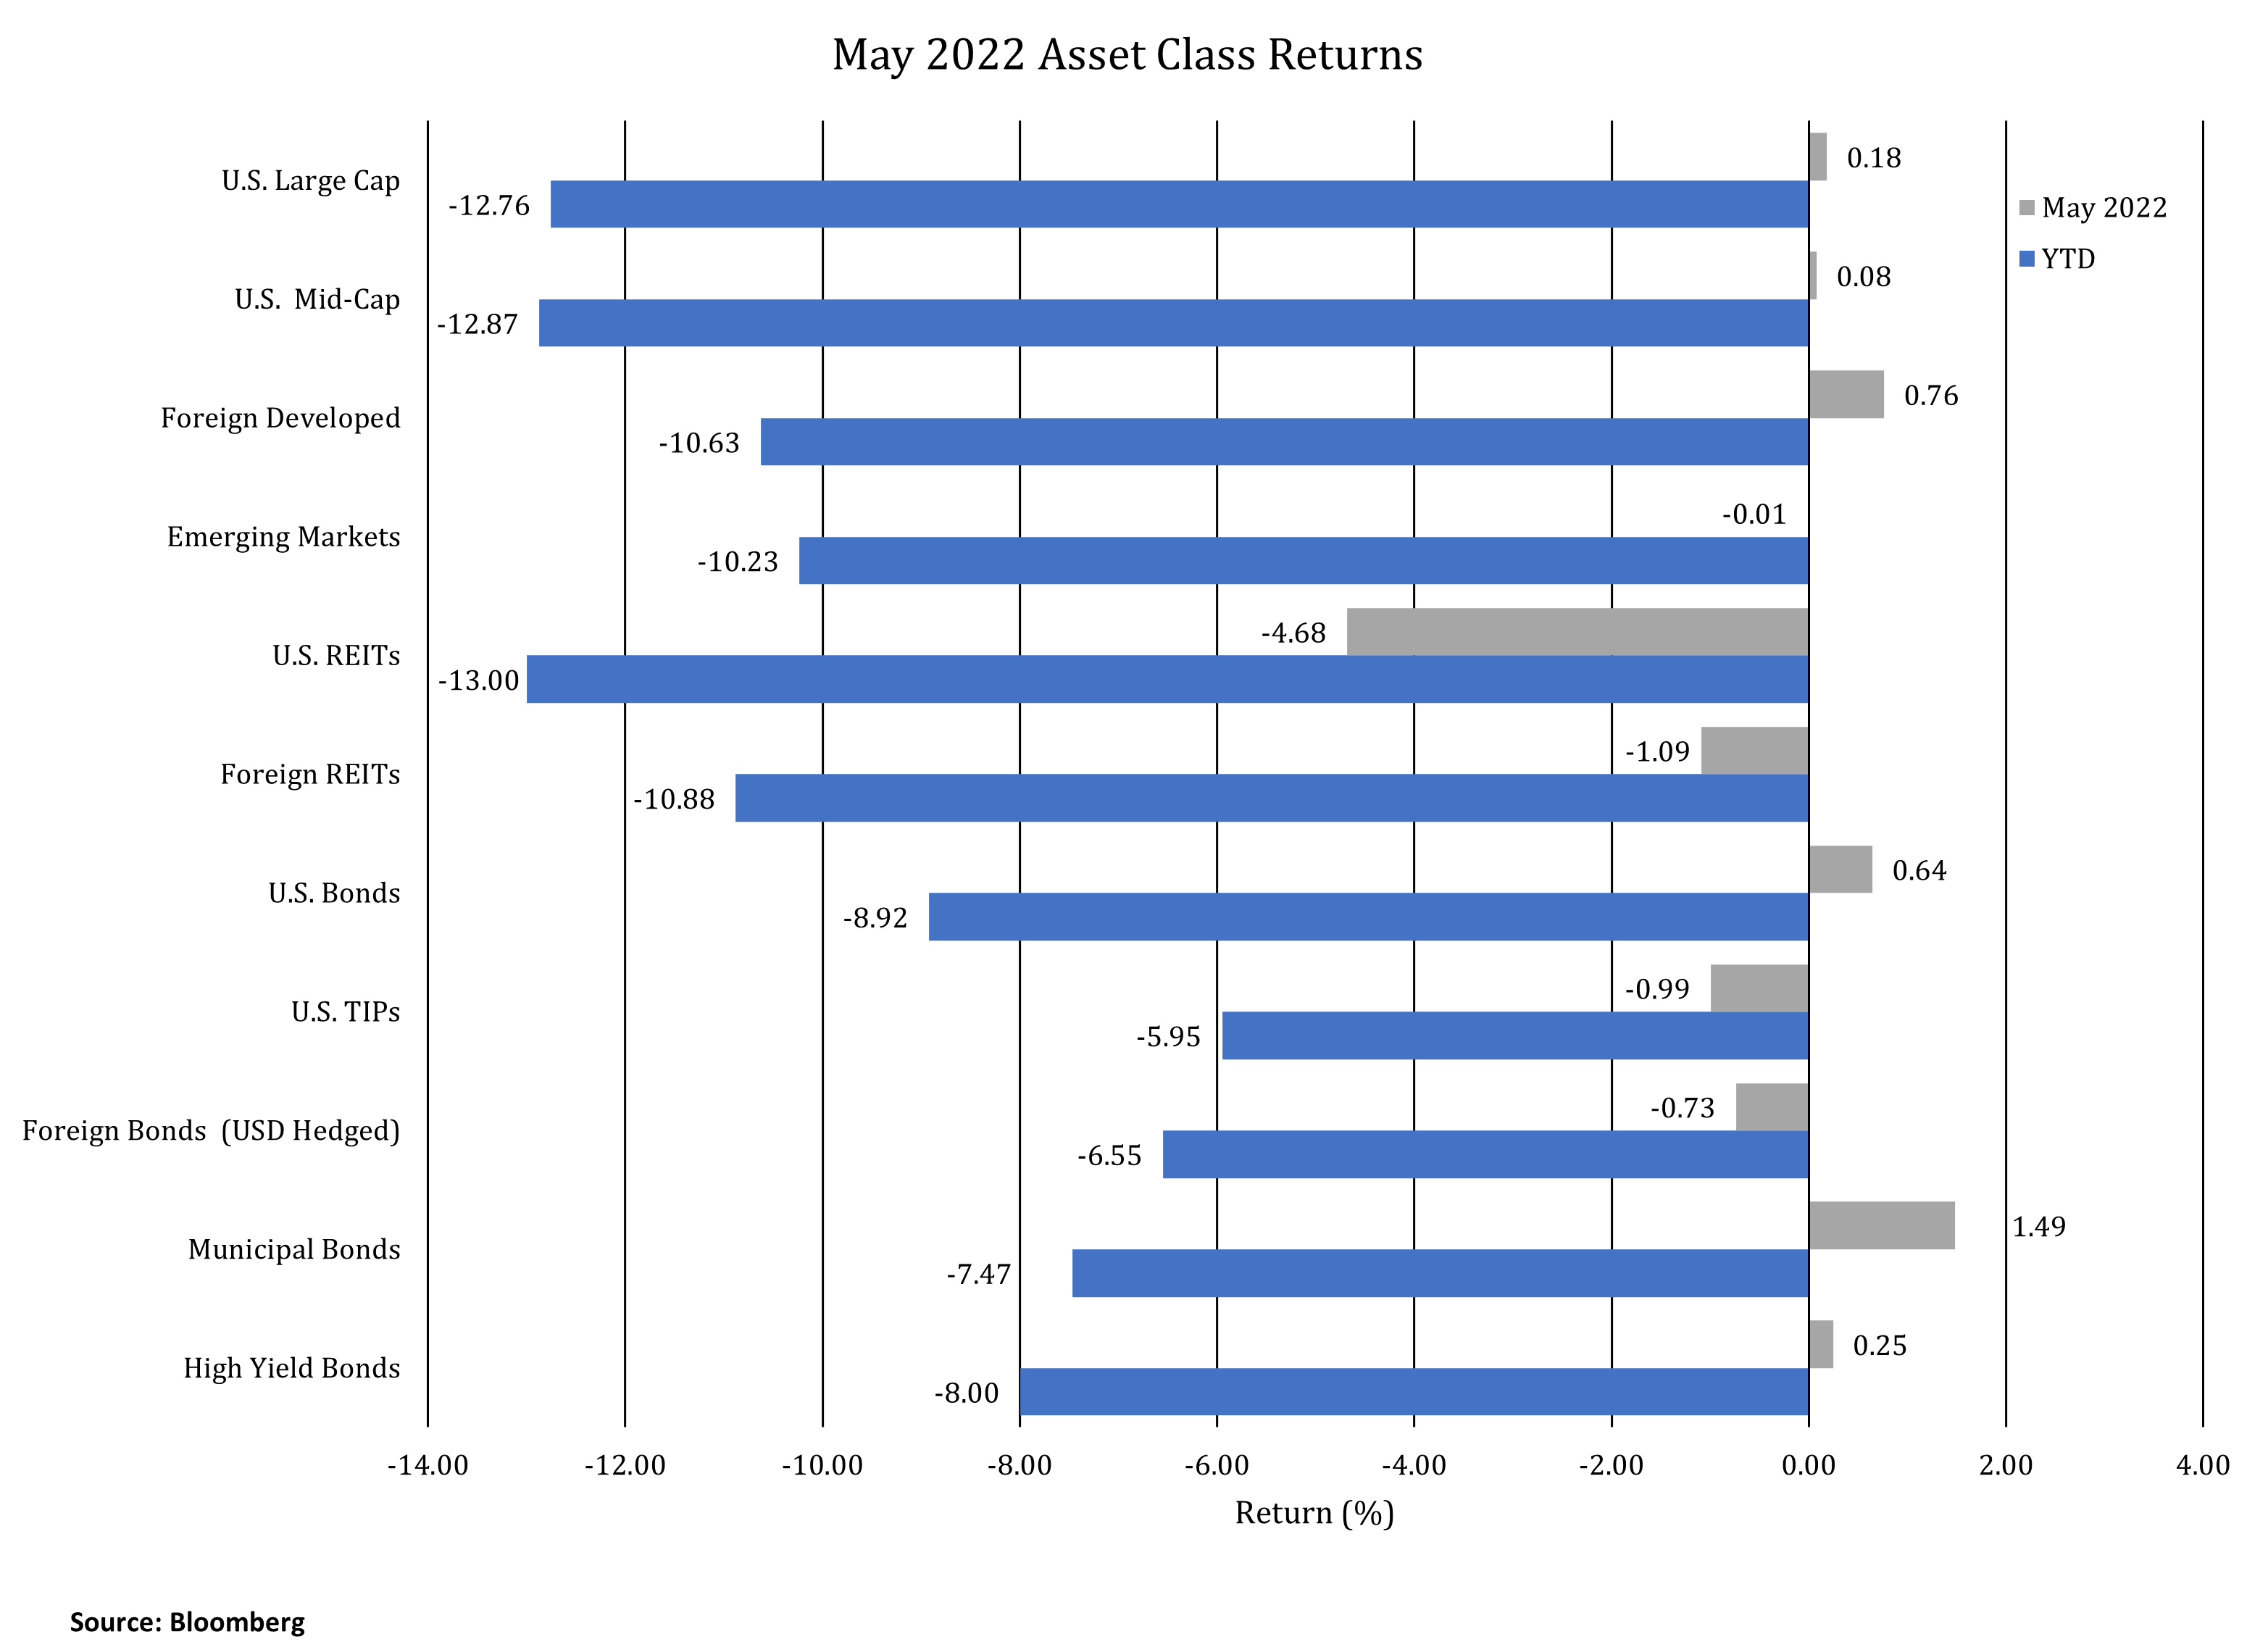
In May, the S&P 500 rose slightly by 0.2% and foreign developed stocks rose 0.8%. U.S. REITs performance lagged, declining 4.7%. During the month, the yield on 10-year Treasuries fell slightly from 2.89% to 2.85%; therefore, bond performance stabilized. We believe the interest rate increases signaled by the Federal Reserve through the rest of this year are generally priced into lower duration bond yields. Interest rates could climb higher if the Fed has to step in more aggressively to fight inflation, resulting in a higher risk of increased rates for longer-dated bonds. Of note, municipal bonds gained 1.5% in May. Year-to-date performance in the major asset classes remains negative.
Underlying inflation data remains high as calculated by year-over-year changes in prices. The latest CPI reading from April was 8.2%, down from 8.6% from the prior month. Data continues to indicate that inflation will not soon abate with recent gasoline inflation at 43.6% and food inflation at 10.6%. Based on available data, the Fed continues to tighten monetary policy.
The Risk of Being Out of the Market
Late May equity performance demonstrates why investors can be hurt by not maintaining a disciplined approach. From May 24th to May 30th, equity asset classes rose approximately 4% to 5%. Investment research indicates again and again the importance of staying invested and not panicking during market corrections.
As an example, Hartford Funds noted that avoiding the market’s declines may mean missing out on its recoveries as well. 78% of the stock market’s best days occur during a bear market or during the first two months of a bull market. If you missed the market’s 10 best days over the past 30 years, your returns would have been cut in half. Missing the best 30 days would have reduced your returns by an astonishing 83%. 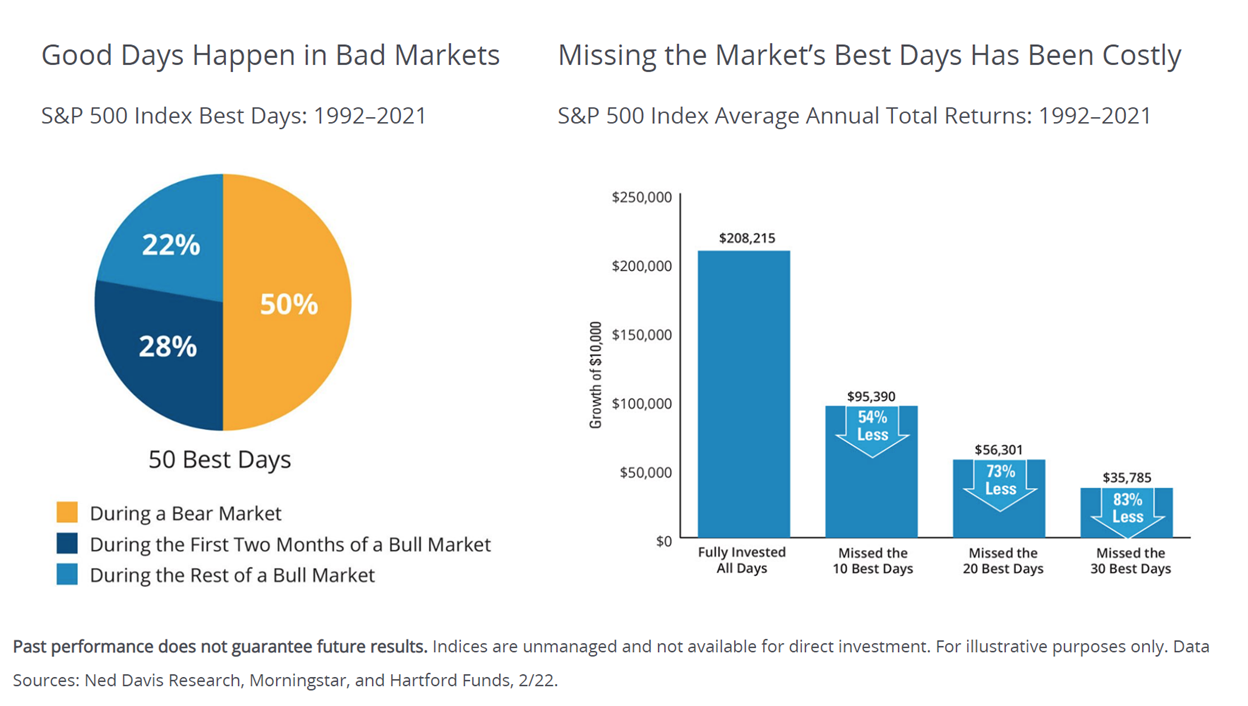
Further investment research shows the outcomes of investors continuing their disciplined investing approach in periods of market corrections.
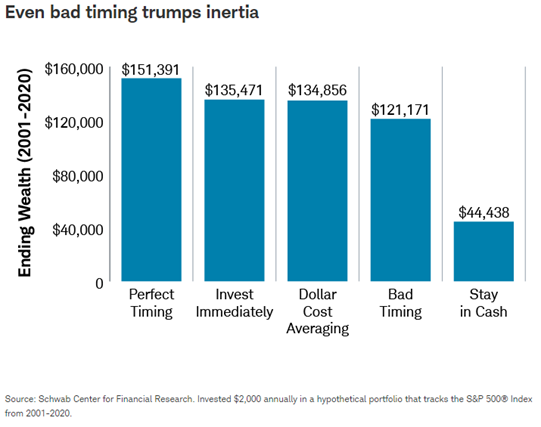
The following chart from Charles Schwab shows the outcomes of performance between investing with perfect timing (impossible to achieve) and bad timing over the period from 2001 to 2020. The biggest danger to long-term portfolio outcomes is not a correction or a bear market: it is being out of the market in high performance periods such as this May’s period, noted above. Furthermore, immediate investing and dollar cost averaging effectively achieve good performance outcomes no matter what the market conditions.
Please contact your JMG advisor with questions or concerns.
Important Disclosure
Please remember that past performance may not be indicative of future results. Different types of investments involve varying degrees of risk, and there can be no assurance that the future performance of any specific investment, investment strategy, or product made reference to directly or indirectly in this writing, will be profitable, equal any corresponding indicated historical performance level(s), or be suitable for your portfolio. Due to various factors, including changing market conditions, the content may no longer be reflective of current opinions or positions. Moreover, you should not assume that any discussion or information contained in this writing serves as the receipt of, or as a substitute for, personalized investment advice from JMG Financial Group, Ltd. To the extent that a reader has any questions regarding the applicability of any specific issue discussed above to his/her individual situation, he/she is encouraged to consult with the professional advisor of his/her choosing. JMG is neither a law firm nor a certified public accounting firm and no portion of the content provided in this writing should be construed as legal or accounting advice. A copy of JMG’s current written disclosure statement discussing advisory services and fees is available for review upon request.
To the extent provided in this writing, historical performance results for investment indices and/or categories have been provided for general comparison purposes only, and generally do not reflect the deduction of transaction and/or custodial charges, the deduction of an investment management fee, nor the impact of taxes, the incurrence of which would have the effect of decreasing historical performance results. It should not be assumed that your account holdings correspond directly to any comparative indices. Indices are not available for direct investment. Market Segment (index representation) as follows: U.S. Large Cap (S&P 500 Total Return); U.S. Mid-Cap (Russell Midcap Index Total Return); Foreign Developed (FTSE Developed Ex U.S. NR USD); Emerging Markets (FTSE Emerging NR USD); U.S. REITs (FTSE NAREIT Equity Total Return Index); Foreign REITs (FTSE EPRA/NAREIT Developed Real Estate Ex U.S. TR); U.S. Bonds (Bloomberg US Aggregate Index); U.S. TIPs (Bloomberg US Treasury Inflation-Linked Bond Index); Foreign Bonds (USD Hedged) (Bloomberg Global Aggregate Ex US TR Hedged); Municipal Bonds (Bloomberg US Municipal Bond Index); High Yield Bonds (Bloomberg US Corporate High Yield Index).