

Tariff Update
INVESTMENT COMMITTEE COMMENTARY April 2025
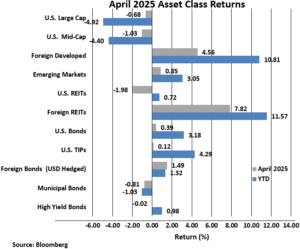
U.S. equities experienced continued volatility in April as tariffs announced by President Trump on April 2nd led to policy uncertainty and trade wars. Intraday and daily volatility also increased on worries that Fed Chair Jerome Powell might be replaced by the president and by concerning news on economic growth, inflation, and public sector unemployment. For the month, U.S. equity indexes declined modestly despite the S&P 500 falling by over 10% in the first two days of April followed by several extreme swings during the month. For April, the S&P 500 fell 0.7% leaving the index down 4.9% for the year.
Diversifying asset classes generally performed well in April and outperformed the S&P 500. Foreign developed country equities gained 4.6% in April and are up 10.8% for the year. Emerging markets equities also had positive performance in April. Foreign equities benefited from a falling U.S. dollar. Notably, foreign REITs gained 7.8% for the month and now have double digit year-to-date returns. Fixed income returns also were positive except for municipal bonds. Municipal bonds were impacted by technical factors such as higher issuance and seasonality which, in total, detracted from performance but should resolve over time.
The yield on 10-year Treasury bonds fell slightly in April from 4.23% to 4.17%. As a result, the Bloomberg U.S. Aggregate Bond Index was up by 0.4%. The markets continue to expect the Federal Reserve (Fed) to cut rates in 2025. The Fed, however, chose not to cut rates last week due to competing concerns about inflation and economic growth related to the tariffs.
Tariff Update
A month has passed since the April 2nd “Liberation Day” tariff policy announcement by President Trump. Since that day, the markets have been trying to digest the impact of those tariffs on economic growth and inflation, while also factoring how those policies may change over time. By historical standards, the S&P 500 valuation continues to be somewhat expensive, which might be a statement by investors about the perceived resilience of the U.S. economy.
There are endless trade and tariff complexities that need to be worked out. As one example, consider that China is a key source of pharmaceutical drugs for the U.S. The share of all U.S. imports for ibuprofen, hydrocortisone, acetaminophen, and penicillin from China are 95%, 91%, 70% and 45% respectively[1]. A large percentage of the U.S. population would likely be impacted by any supply disruptions for these drugs. This is one example of many (like the auto industry) where the goal of onshoring manufacturing in the U.S. is realistically a long-term proposition (years, not months). It involves building large manufacturing facilities in the U.S., employing and training workers, while also maintaining business profitability in the interim period. These are major challenges for businesses and the investment markets may continue to have difficulty quantifying the risks.
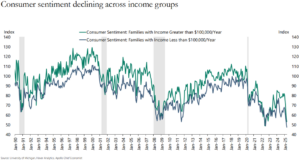
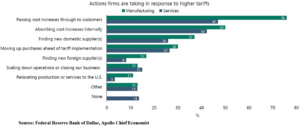
The tariff uncertainty has caused a rapid decline in consumer sentiment to levels similar to the Great Financial Crisis of 2007-2009. People are worried about how tariffs might be passed on to them and the resulting inflation that could be reignited. The following charts provide current information on sentiment and how business is passing tariffs to consumers.
U.S. equity markets have, for now, backed off the steep losses of early April, and taken more of a wait and see approach. This is the case despite some challenging news, including falling earnings forecasts, rising inflation expectations, and a negative GDP report for the first quarter (caused largely by pre-tariff imports). Many firms have pulled their earnings guidance completely due to the uncertainty surrounding tariffs. This wait and see approach makes sense given the broad range of policy outcomes surrounding ongoing tariff related negotiations. As of this writing, the U.S. cemented its first bilateral trade agreement with the U.K., while talks with China have led to an agreement on a 90-day reprieve which includes a reduction in tariff rates between the two countries. In related news, the U.K. signed a bilateral trade agreement with India. We continue to monitor the policy landscape, economic and market data, and continue to have conviction in our diversified investment approach and our current portfolio positioning.
If you have any questions, please consult your JMG Advisor.
Reference:
[1] – Skyrocketing Pharmaceutical Imports to the US Endanger National Security | Coalition For A Prosperous America, The geography of prescription pharmaceuticals supplied to the USA: levels, trends, and implications – PMC, Apollo Chief Economist
Important Disclosure
Please remember that past performance may not be indicative of future results. Different types of investments involve varying degrees of risk, and there can be no assurance that the future performance of any specific investment, investment strategy, or product (including the investments and/or investment strategies recommended or undertaken by JMG Financial Group Ltd. (“JMG”), or any non-investment related content, made reference to directly or indirectly in this writing will be profitable, equal any corresponding indicated historical performance level(s), be suitable for your portfolio or individual situation, or prove successful. Due to various factors, including changing market conditions and/or applicable laws, the content may no longer be reflective of current opinions or positions. Moreover, you should not assume that any discussion or information contained in this writing serves as the receipt of, or as a substitute for, personalized investment advice from JMG. To the extent that a reader has any questions regarding the applicability of any specific issue discussed above to his/her individual situation, he/she is encouraged to consult with the professional advisor of his/her choosing. JMG is neither a law firm, nor a certified public accounting firm, and no portion of the content provided in this writing should be construed as legal or accounting advice. A copy of JMG’s current written disclosure Brochure discussing our advisory services and fees is available upon request. If you are a JMG client, please remember to contact JMG, in writing, if there are any changes in your personal/financial situation or investment objectives for the purpose of reviewing/evaluating/revising our previous recommendations and/or services, or if you would like to impose, add, or to modify any reasonable restrictions to our investment advisory services. JMG shall continue to rely on the accuracy of information that you have provided.
To the extent provided in this writing, historical performance results for investment indices and/or categories have been provided for general comparison purposes only, and generally do not reflect the deduction of transaction and/or custodial charges, the deduction of an investment management fee, nor the impact of taxes, the incurrence of which would have the effect of decreasing historical performance results. It should not be assumed that your account holdings correspond directly to any comparative indices. Indices are not available for direct investment.
Market Segment (index representation) as follows: U.S. Large Cap (S&P Total Return); U.S. Mid-Cap (Russell Midcap Index Total Return); Foreign Developed (FTSE Developed Ex U.S. NR USD); Emerging Markets (FTSE Emerging NR USD); U.S. REITs (FTSE NAREIT Equity Total Return Index); Foreign REITs (FTSE EPRA/NAREIT Developed Real Estate Ex U.S. TR); U.S Bonds (Bloomberg US Aggregate Bond Index); U.S. TIPs (Bloomberg US Treasury Inflation-Linked Bond Index); Foreign Bond (USD Hedged) (Bloomberg Global Aggregate Ex US TR Hedged); Municipal Bonds (Bloomberg US Municipal Bond Index); High Yield Bonds (Bloomberg US Corporate High Yield Index).