

Stock Market Declines and Recoveries
INVESTMENT COMMITTEE COMMENTARY SEPTEMBER 2021
September is historically the worst month for U.S. stock market performance. Since 1926, it is the only month where the average stock market returns are negative. This year, equities also declined in September. This month’s drawdown occurred after the S&P 500 had delivered its best performance through August since 1997.
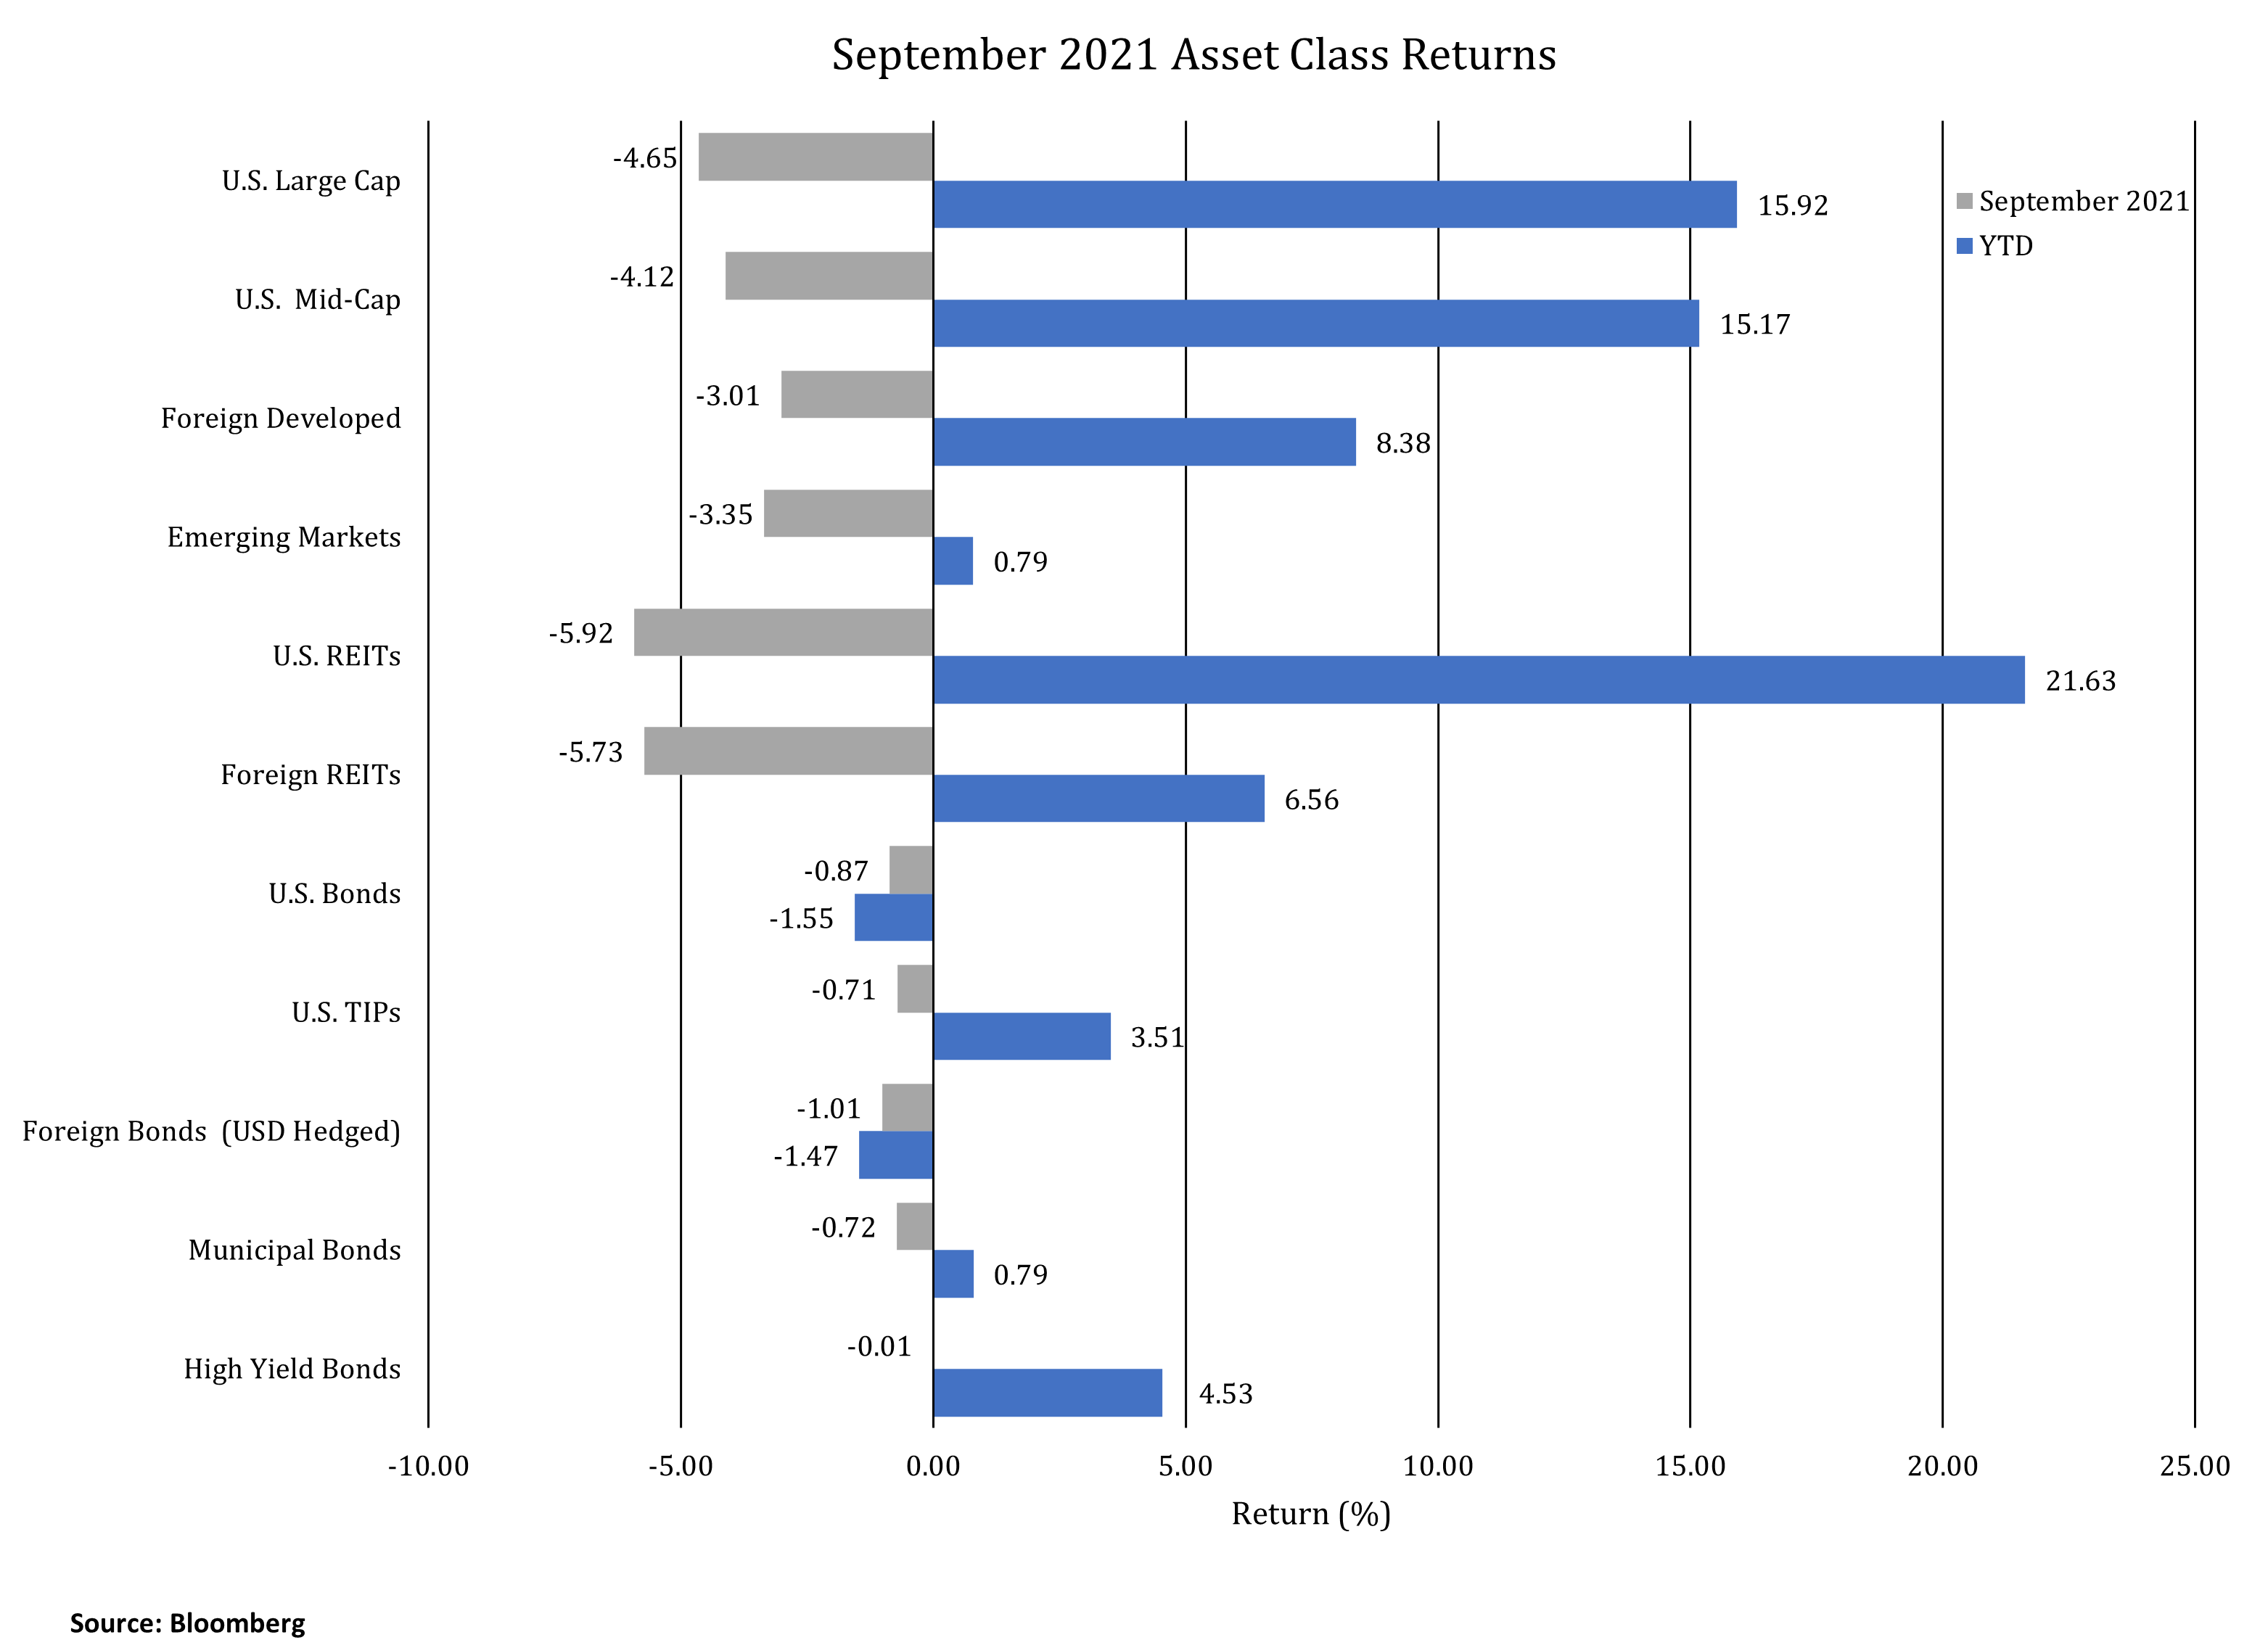
In September, the S&P 500 fell 4.65%. A host of issues weighed on investors’ minds. The COVID delta variant spike peaked in early September with the seven-day average at about 192,000 cases. That number dropped to about 103,000 cases by October 1st but is still well above July levels. With COVID concerns, and the associated pace and timing of reopening the economy, continued economic growth became questionable. However, U.S. growth is expected to pick up in the fourth quarter of 2021 with less pandemic drag on the economy. Uncertainty regarding jobs may also be weighing on markets as some employers struggle to find workers even as enhanced unemployment benefits are ending. The spike in inflation is also lasting longer than expected as many global supply chain issues remain unresolved. Internationally, growth in China is slowing. This month, China’s second largest property developer, Evergrande, struggled to meet debt payment deadlines.
During September, the yield on 10-year U.S. Treasuries rose from 1.30% to 1.53%. The yield moved to its highest point since June. As a result, bond prices fell in September. The Bloomberg U.S. Aggregate Bond Index dropped by 0.87% on the increase in yields. U.S. Treasury Inflation Protected Securities (TIPS), municipal bonds and corporate high yield bonds also recorded negative performance in September but their returns remain positive for the year.
Stock Market Volatility
The S&P 500 declined by 4.65% in September. Since the March 2020 coronavirus economic shutdown and resulting steep market decline, equity markets have consistently moved higher without a material decline. It is uncharacteristic for stock prices to move up in such a straight line. Performance tends to be jagged with frequent market pullbacks. The following chart presents data on stock market declines since 1945.
S&P 500: Declines & Recoveries since 12/31/1945
Data as of 9/30/2021
| Decline (%) | Number of Occurrences | Average Decline (%) | Average Duration of Decline (Months) | Average Time to Recover (Months) |
|---|---|---|---|---|
| 5-10 | 85 | -7 | 1 | 2 |
| 10-20 | 29 | -14 | 4 | 4 |
| 20-40 | 9 | -28 | 11 | 14 |
| 40+ | 3 | -51 | 23 | 58 |
Copyright 2021 Ned Davis Research, Inc. Further distribution prohibited without prior permission. All rights reserved. See NDR disclaimer at https://www.ndr.com/copyright.html. For data vendor disclaimers refer to www.ndr.com/vendorinfo.
Recognizing the frequency of market declines, investors should be prepared to invest through such periods and potentially find profitable opportunities. The following are some perspectives on stock market volatility.
- Most market pullbacks are modest declines of less than 10%. One does not know if a modest decline will worsen, but the largest declines have typically occurred in the midst of deep economic recessions. Today, we see economic disruptions from the COVID crisis, with the U.S. economy in recovery and not recession. Therefore, there is a lower probability of a steep market decline.
- Market declines often allow for better investment entry points. They provide opportunities to analyze and assess market conditions and valuations. While no one can consistently predict market declines and turnarounds, staying disciplined through market volatility serves investors well.
- Losing patience as an investor near a market bottom can lead to permanent losses of capital. The willingness to rebalance in market downturns when it is uncomfortable can often lead to more profitable results.
- Market pullbacks often allow for planning opportunities and income tax management.
If you have any questions, you should consult with your JMG Advisor.
Important Disclosure
Please remember that past performance may not be indicative of future results. Different types of investments involve varying degrees of risk, and there can be no assurance that the future performance of any specific investment, investment strategy, or product made reference to directly or indirectly in this writing, will be profitable, equal any corresponding indicated historical performance level(s), or be suitable for your portfolio. Due to various factors, including changing market conditions, the content may no longer be reflective of current opinions or positions. Moreover, you should not assume that any discussion or information contained in this writing serves as the receipt of, or as a substitute for, personalized investment advice from JMG Financial Group, Ltd. To the extent that a reader has any questions regarding the applicability of any specific issue discussed above to his/her individual situation, he/she is encouraged to consult with the professional advisor of his/her choosing. JMG is neither a law firm nor a certified public accounting firm and no portion of the content provided in this writing should be construed as legal or accounting advice. A copy of JMG’s current written disclosure statement discussing advisory services and fees is available for review upon request.
To the extent provided in this writing, historical performance results for investment indices and/or categories have been provided for general comparison purposes only, and generally do not reflect the deduction of transaction and/or custodial charges, the deduction of an investment management fee, nor the impact of taxes, the incurrence of which would have the effect of decreasing historical performance results. It should not be assumed that your account holdings correspond directly to any comparative indices. Indices are not available for direct investment. Market Segment (index representation) as follows: U.S. Large Cap (S&P 500 Total Return); U.S. Mid-Cap (Russell Midcap Index Total Return); Foreign Developed (FTSE Developed Ex U.S. NR USD); Emerging Markets (FTSE Emerging NR USD); U.S. REITs (FTSE NAREIT Equity Total Return Index); Foreign REITs (FTSE EPRA/NAREIT Developed Real Estate Ex U.S. TR); U.S. Bonds (Bloomberg US Aggregate Index); U.S. TIPs (Bloomberg US Treasury Inflation-Linked Bond Index); Foreign Bonds (USD Hedged) (Bloomberg Global Aggregate Ex US TR Hedged); Municipal Bonds (Bloomberg US Municipal Bond Index); High Yield Bonds (Bloomberg US Corporate High Yield Index).