

Real Estate Investment Trusts (REITs)
INVESTMENT COMMITTEE COMMENTARY OCTOBER 2021
After a modest 5% stock market pullback in September, the S&P 500 moved sharply higher in October. The fourth quarter is historically the strongest of the year for the stock market.
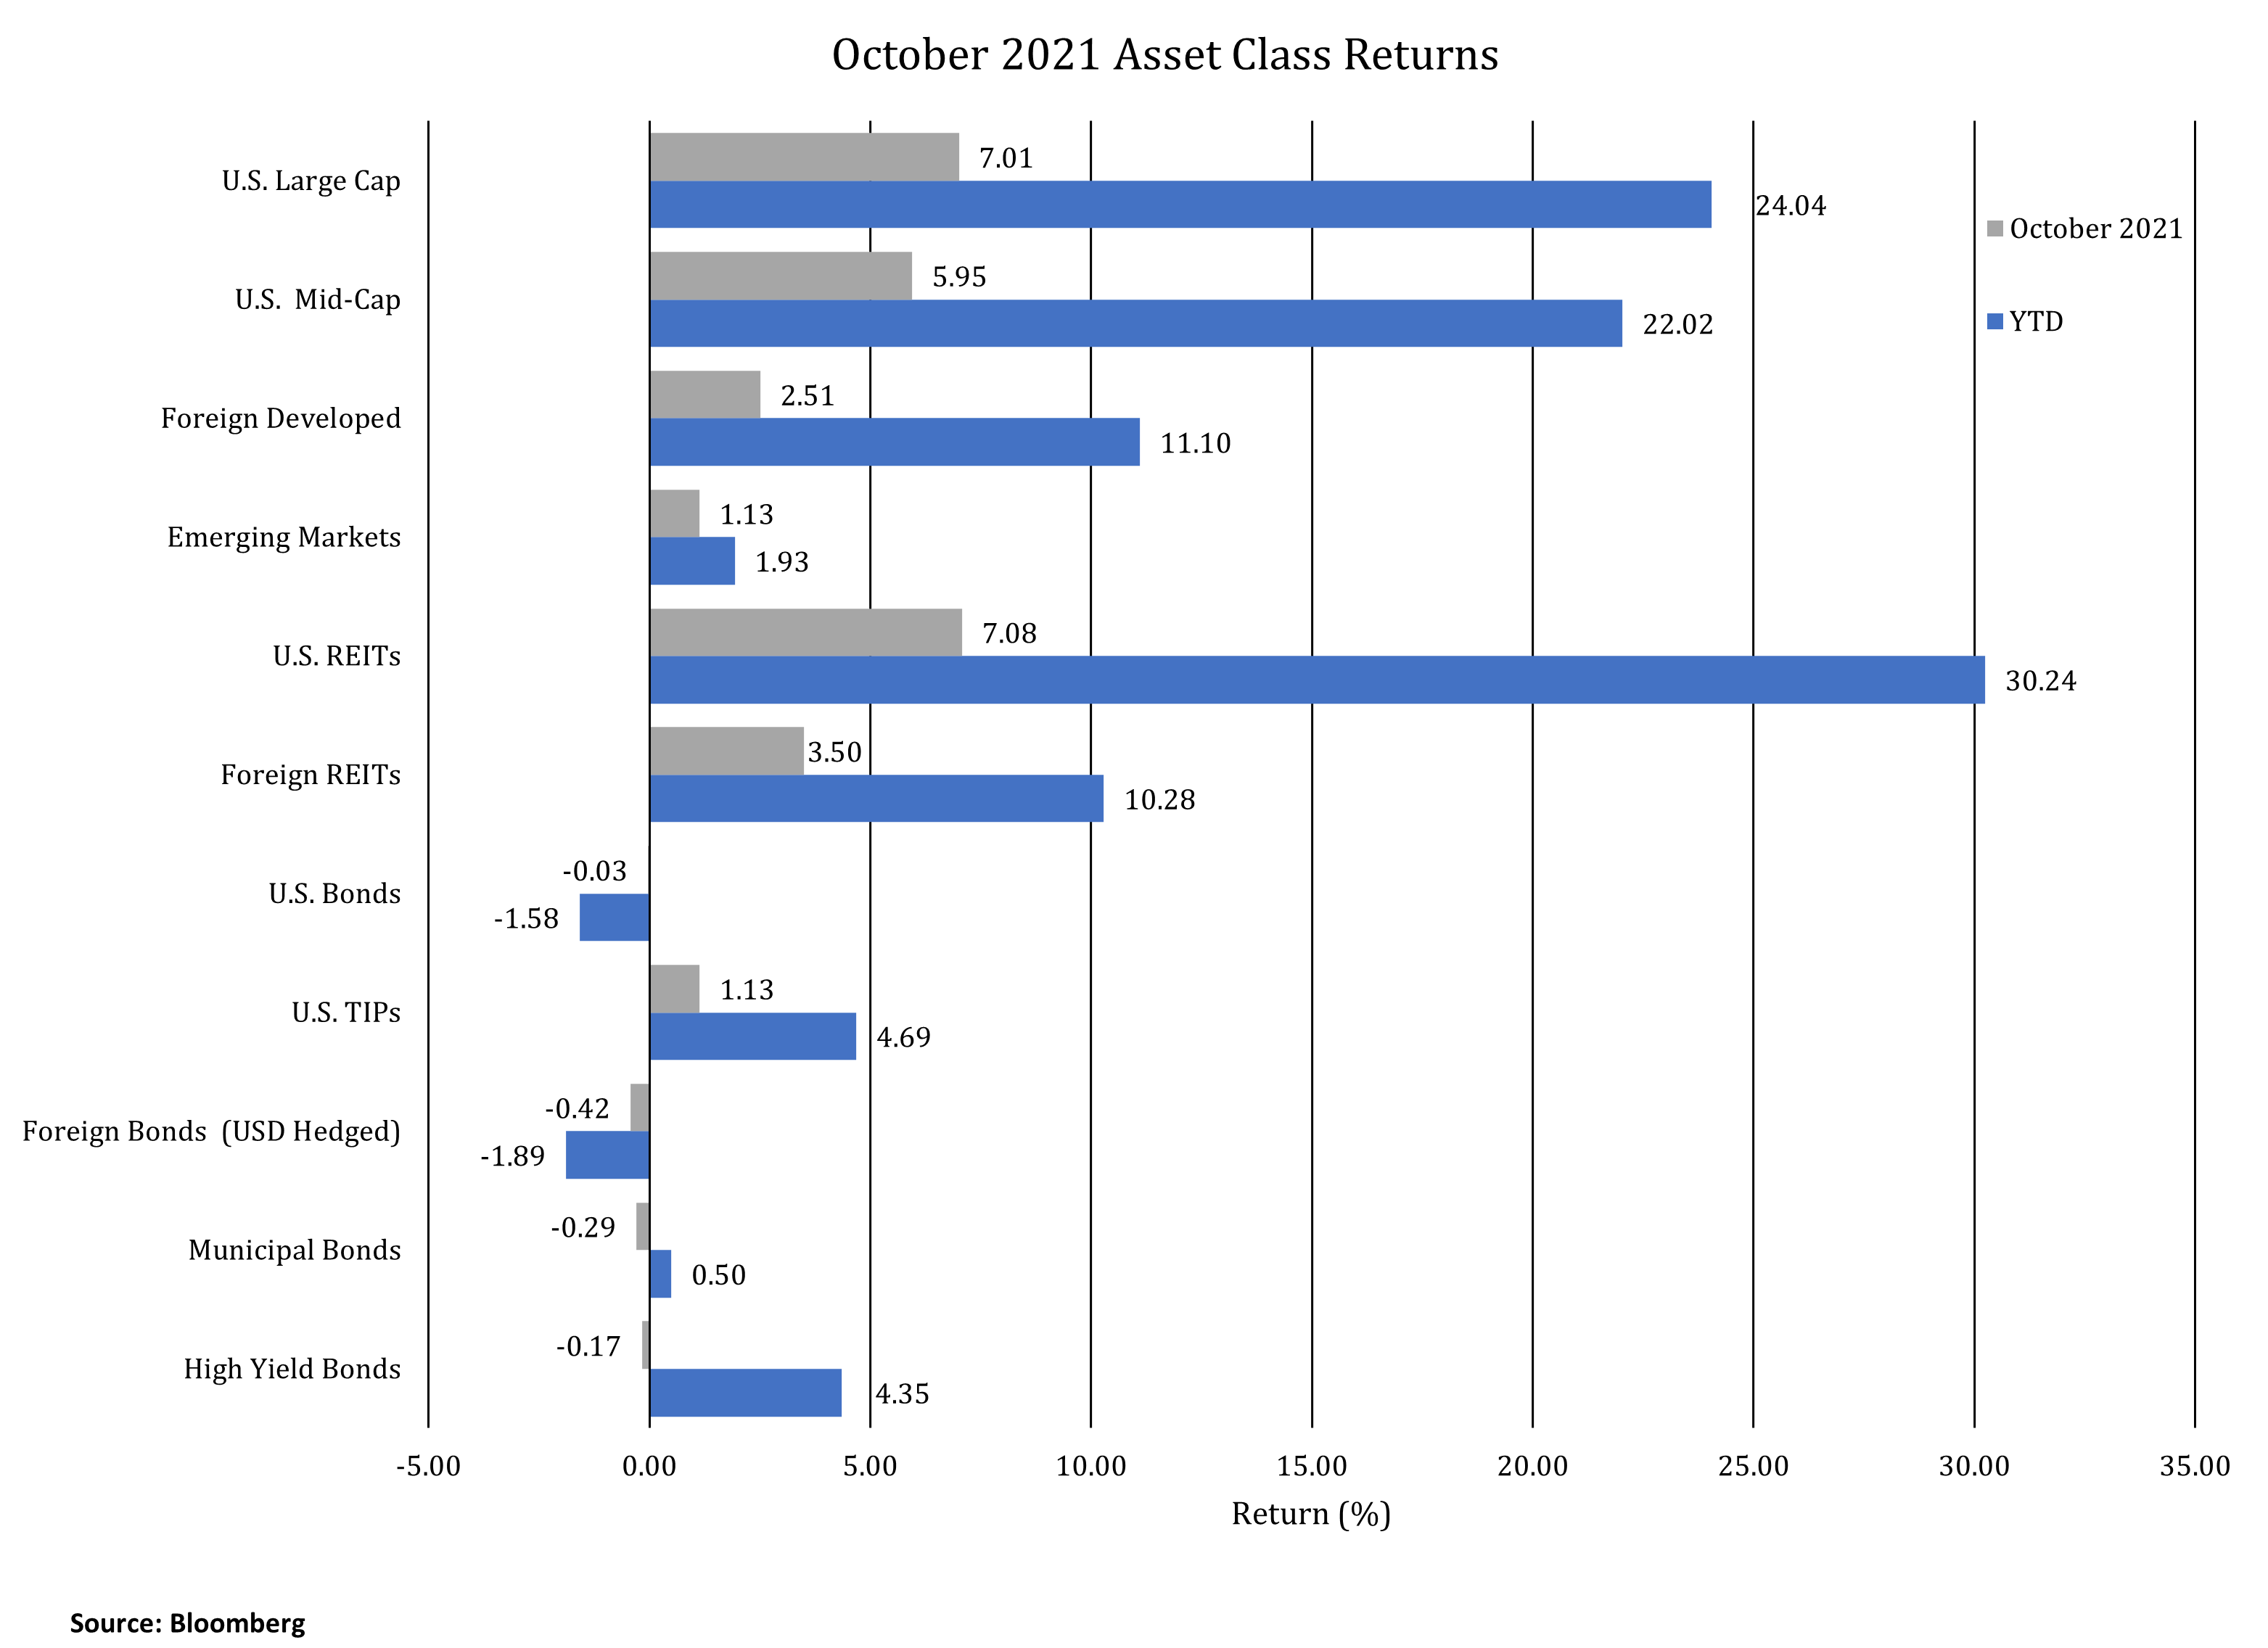
In October, the S&P 500 gained 7% bringing the year-to-date total return to 24%. New cases of COVID-19 continued to decline. The Center for Disease Control and Prevention reported the 7-day average for new cases decreased from about 103,000 cases to 69,000 cases. Investors appeared to put aside recent concerns and invested with expectations that world supply chain disruptions will ease, economic growth will continue, and inflation will be managed. Other U.S. equity sub-asset classes, including mid-cap stocks and real estate investment trusts (REITs), also had strong performance and outperformed foreign and emerging market stocks in October.
During October, the yield on the 10-year U.S. Treasury rose from 1.53% to 1.56%. As a result, fixed income returns fell slightly for the month. U.S. Treasury Inflation Protected Securities (TIPS) have a positive return in 2021 as inflation expectations have moved higher. High yield corporate bonds also have positive returns as the economy and corporate earnings have improved relative to 2020.
Real Estate Investment Trusts (REITs)
REITs, and in particular, U.S. REITs have performed well in 2021. While real estate has recently become its own sector in the S&P 500, JMG separately includes and analyzes REITs in client portfolios. As a real asset class, there are market periods where REITs provide favorable diversification in portfolios. The asset class can have favorable performance in both inflationary periods as well as during increasing interest rate environments.
Some have questioned how 2021 U.S. REIT performance can be so strong in the midst of the COVID pandemic. In particular, offices, shopping centers, malls, and hotels would seem to have performance concerns from falling demand and revenues. While it is true these REIT industries could be detracting from REIT performance, the overall composition of the REIT index has changed over time.
Of note, a higher proportion of REITs are now in industries associated with e-commerce. Specialized REITs include data centers (often associated with cloud computing) and cell towers. Index weightings in retail and office REITs have somewhat declined. Additionally, real estate operators adapt and properties are being repurposed to potentially increase values. For example, some malls are being transformed to mixed use residential / retail properties.
The following shows the composition of the S&P 500 Developed REIT Index and historical total returns.
| S&P Developed REIT Index 1 | ||||||
| Industry | Index Weight | YTD – 10/31/2021 |
2020 | 3 Year | 5 Year | |
|---|---|---|---|---|---|---|
| Industrial | 18% | 30.3% | 19.7% | 29.6% | 22.9% | |
| Specialized | 18% | 18.0% | 13.4% | 18.6% | 15.7% | |
| Retail | 16% | 26.4% | -24.9% | 0.1% | -0.5% | |
| Residential | 16% | 41.3% | -9.3% | 18.8% | 14% | |
| Office | 11% | 13.4% | -17.5% | 5.3% | 4.5% | |
| Diversified | 11% | 14.9% | -10.4% | 9.9% | 6.7% | |
| Health Care | 8% | 12.1% | -8.6% | 8.5% | 2.6% | |
| Hotel/Resort | 3% | 14.9% | -27.5% | -3.9% | 2.6% | |
| Source: S&P Dow Jones and Morningstar | ||||||
| 1 The S&P Developed REIT serves as a comprehensive benchmark of publicly traded equity REITs domiciled in developed markets. | ||||||
It is important to note that a portion of this year’s strong REIT performance represents a recovery from weak 2020 relative performance and drawdowns. Over longer periods, performance of REITs will be driven by the net operating income of the properties and the return investors are willing to pay for the ongoing cash flow generated by each underlying property.
If you have any questions, you should consult with your JMG Advisor.
Important Disclosure
Please remember that past performance may not be indicative of future results. Different types of investments involve varying degrees of risk, and there can be no assurance that the future performance of any specific investment, investment strategy, or product made reference to directly or indirectly in this writing, will be profitable, equal any corresponding indicated historical performance level(s), or be suitable for your portfolio. Due to various factors, including changing market conditions, the content may no longer be reflective of current opinions or positions. Moreover, you should not assume that any discussion or information contained in this writing serves as the receipt of, or as a substitute for, personalized investment advice from JMG Financial Group, Ltd. To the extent that a reader has any questions regarding the applicability of any specific issue discussed above to his/her individual situation, he/she is encouraged to consult with the professional advisor of his/her choosing. JMG is neither a law firm nor a certified public accounting firm and no portion of the content provided in this writing should be construed as legal or accounting advice. A copy of JMG’s current written disclosure statement discussing advisory services and fees is available for review upon request.
To the extent provided in this writing, historical performance results for investment indices and/or categories have been provided for general comparison purposes only, and generally do not reflect the deduction of transaction and/or custodial charges, the deduction of an investment management fee, nor the impact of taxes, the incurrence of which would have the effect of decreasing historical performance results. It should not be assumed that your account holdings correspond directly to any comparative indices. Indices are not available for direct investment. Market Segment (index representation) as follows: U.S. Large Cap (S&P 500 Total Return); U.S. Mid-Cap (Russell Midcap Index Total Return); Foreign Developed (FTSE Developed Ex U.S. NR USD); Emerging Markets (FTSE Emerging NR USD); U.S. REITs (FTSE NAREIT Equity Total Return Index); Foreign REITs (FTSE EPRA/NAREIT Developed Real Estate Ex U.S. TR); U.S. Bonds (Bloomberg US Aggregate Index); U.S. TIPs (Bloomberg US Treasury Inflation-Linked Bond Index); Foreign Bonds (USD Hedged) (Bloomberg Global Aggregate Ex US TR Hedged); Municipal Bonds (Bloomberg US Municipal Bond Index); High Yield Bonds (Bloomberg US Corporate High Yield Index).