

Missed Opportunities with Market Timing
INVESTMENT COMMITTEE COMMENTARY November 2023
Stocks had strong gains in November and reversed a seasonal trend of weaker performance. Recent inflation data showed that inflation is continuing to recede. Investors turned optimistic as the Federal Reserve (Fed) held interest rates level in November, leading to a greater expectation that the Fed is done raising interest rates in this economic cycle.
The U.S. economy has proven resilient despite an autoworkers strike, the ongoing war in Ukraine, and the Israel-Hamas war. Third quarter gross domestic product (GDP) expanded at an annualized rate of 5.2%. Consumer spending, which is approximately 70% of the economy, rose with increased spending in durable goods, nondurable goods, and services.
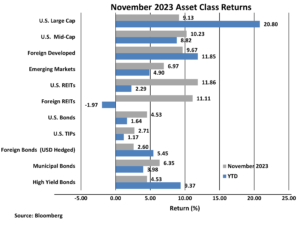
The S&P 500 rose 9.1% in November and is now up 20.8% for the year. The broader equity asset classes also performed well as foreign developed and emerging market equities gained 9.7% and 7.0%, respectively. Notably, U.S. and foreign REITs, which have had lagging performance in 2023, each had monthly returns above 11%. Overall, November provided a welcome recovery in stock performance.
Bonds also had strong November performance. The yield on 10-year Treasuries unexpectedly fell from 4.88% to 4.37%. This decrease helped the Bloomberg U.S. Aggregate Bond Index to gain 4.5% during the month. High yield bonds and foreign bonds (USD hedged) also had gains in November. Year-to-date bond index returns are now positive.
Impact of Being Out of the Market for Short Periods of Time
The last two months (October market decline / November market recovery) illustrate the difficulty of market timing as equity prices are volatile and can move rapidly over short periods of time. As we have reminded clients over the years, investment research shows the impact of being out of the stock market for just a short period of time can be profound.
There is no consistent process to target and invest on the best market days and then accurately move to the sidelines to avoid the worst market days. Of course, as long as markets exist, some investors will continue attempts to time good and bad markets. More often, however, those attempts will detract from long-term investment performance. Research shows the best and worst market days often occur in close proximity to each other. Research also shows missing only a brief period of strong returns can drastically reduce long-term portfolio performance.
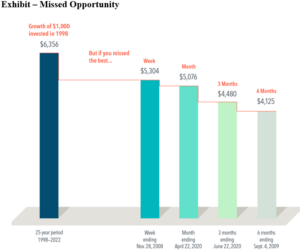
The following Exhibit considers a hypothetical investment in stocks represented by the Russell 3000 Index, a broad U.S. stock market benchmark index. A $1,000 investment made in 1998 turns into $6,356 for the 25-year period ending December 31, 2022. Over that same period, if you just miss the Russell 3000’s best week, which ended November 28, 2008, the value shrinks to $5,304. Miss the three best months, which ended June 22, 2020, and the total return dwindles to $4,480.
![]()
Update on Market Valuations
Last month, we highlighted that large, technology-oriented stocks in the S&P 500 (sometimes referred to as “The Magnificent Seven”) were driving the index performance with unusually high valuations. The rest of the companies in the index, taken as a whole, were essentially flat for the year and had reasonable valuations. We were pleased to see the November market rally was more broad-based with all sectors participating. We still, however, remain concerned about the historically high valuations of these technology-oriented companies that have far outperformed the broader market. Large-cap growth stocks are now trading at a 36% premium to their 20-year average. We don’t believe this valuation disparity is sustainable unless these companies are able to deliver exceptional earnings going forward.
While some investors are shifting further into large-cap growth stocks, we advise that our clients maintain a more broadly diversified allocation to U.S. stocks, including an allocation to much more attractively valued small-cap stocks.
If you have any questions, please consult your JMG Advisor.
Important Disclosure
Please remember that past performance may not be indicative of future results. Different types of investments involve varying degrees of risk, and there can be no assurance that the future performance of any specific investment, investment strategy, or product (including the investments and/or investment strategies recommended or undertaken by JMG Financial Group Ltd. (“JMG”), or any non-investment related content, made reference to directly or indirectly in this writing will be profitable, equal any corresponding indicated historical performance level(s), be suitable for your portfolio or individual situation, or prove successful. Due to various factors, including changing market conditions and/or applicable laws, the content may no longer be reflective of current opinions or positions. Moreover, you should not assume that any discussion or information contained in this writing serves as the receipt of, or as a substitute for, personalized investment advice from JMG. To the extent that a reader has any questions regarding the applicability of any specific issue discussed above to his/her individual situation, he/she is encouraged to consult with the professional advisor of his/her choosing. JMG is neither a law firm, nor a certified public accounting firm, and no portion of the content provided in this writing should be construed as legal or accounting advice. A copy of JMG’s current written disclosure Brochure discussing our advisory services and fees is available upon request. If you are a JMG client, please remember to contact JMG, in writing, if there are any changes in your personal/financial situation or investment objectives for the purpose of reviewing/evaluating/revising our previous recommendations and/or services, or if you would like to impose, add, or to modify any reasonable restrictions to our investment advisory services. JMG shall continue to rely on the accuracy of information that you have provided.
To the extent provided in this writing, historical performance results for investment indices and/or categories have been provided for general comparison purposes only, and generally do not reflect the deduction of transaction and/or custodial charges, the deduction of an investment management fee, nor the impact of taxes, the incurrence of which would have the effect of decreasing historical performance results. It should not be assumed that your account holdings correspond directly to any comparative indices. Indices are not available for direct investment.
Market Segment (index representation) as follows: U.S. Large Cap (S&P Total Return); U.S. Mid-Cap (Russell Midcap Index Total Return); Foreign Developed (FTSE Developed Ex U.S. NR USD); Emerging Markets (FTSE Emerging NR USD); U.S. REITs (FTSE NAREIT Equity Total Return Index); Foreign REITs (FTSE EPRA/NAREIT Developed Real Estate Ex U.S. TR); U.S Bonds (Bloomberg US Aggregate Bond Index); U.S. TIPs (Bloomberg US Treasury Inflation-Linked Bond Index); Foreign Bond (USD Hedged) (Bloomberg Global Aggregate Ex US TR Hedged); Municipal Bonds (Bloomberg US Municipal Bond Index); High Yield Bonds (Bloomberg US Corporate High Yield Index).
Dimensional Fund Advisors Disclosure
Past performance, including hypothetical performance, is not a guarantee of future results. The exhibit is presented In US dollars for illustrative purposes. Best performance dates represent end of period (November 28, 2008, for best week; April 22, 2020, for best month; June 22, 2020, for best three months; and September 4, 2009, for best six months). The missed best consecutive days examples assume that the hypothetical portfolio fully divested its holdings at the end of the day before the missed best consecutive days, held cash for the missed best consecutive days, and reinvested the entire portfolio in the Russell 3000 Index at the end of the missed best consecutive days. Data presented in the growth of $1000 exhibit is hypothetical and assumes reinvestment of income and no transaction costs or taxes. The data is for illustrative purposes only and is not indicative of any investment. Frank Russell Company is the source and owner of the trademarks, service marks, and copyrights related to the Russell Indexes. Indices are not available for direct investment. Their performance does not reflect the expenses associated with the management of an actual portfolio.