
Monthly Economic News
Monthly Economic News
Mid-Year Commentary
INVESTMENT COMMITTEE COMMENTARY JUNE 2021
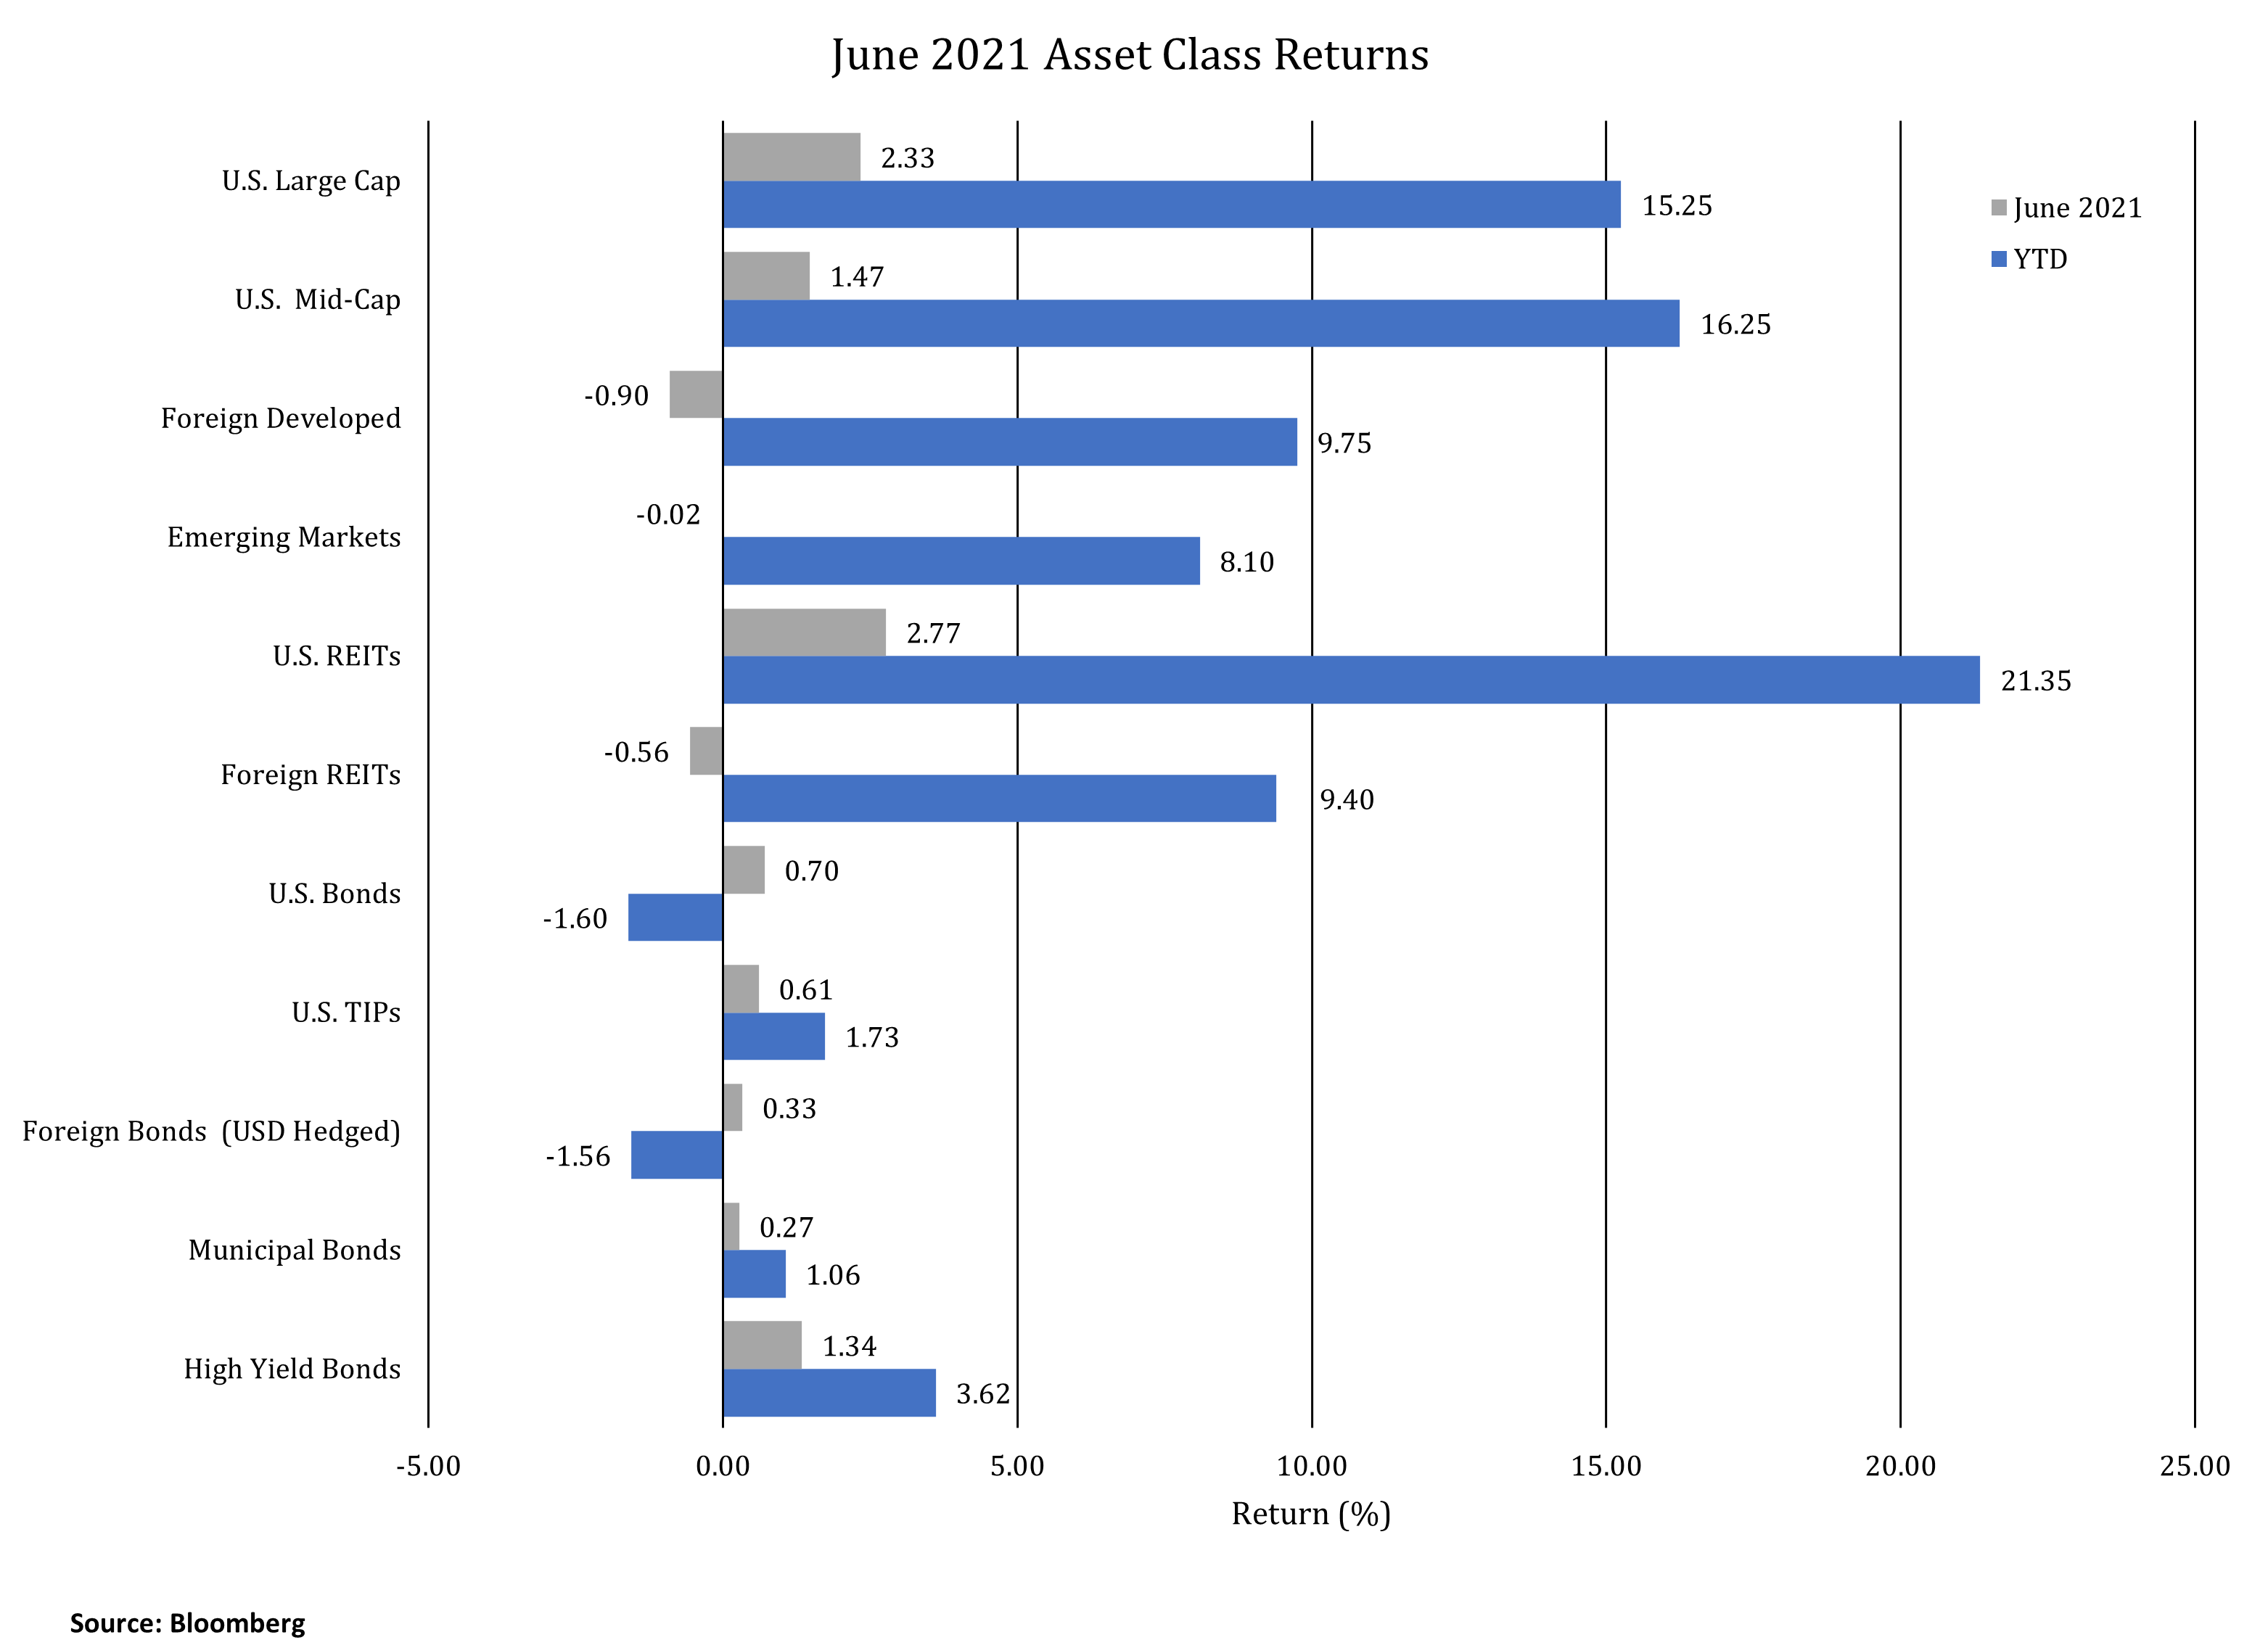
Risk assets had mixed performance in June as U.S. equities rose while foreign and emerging market equities were flat or down modestly. As we end the first half of 2021, global economies are on a solid recovery path as vaccinations continue in the U.S. and in other developed countries, particularly Europe. Emerging market country vaccinations are still lagging and concerns of a COVID resurgence in Southeast Asia have recently hurt equity performance and impacted capital flows into the region.
In June, the S&P 500 rose 2.3% as the U.S. economy continued to reopen, particularly the restaurant, travel and leisure industries. The Federal Reserve remained accommodative at its June meeting with Chairman Powell expecting strong U.S. job creation into the fall. The Fed acknowledged higher inflation, but believes it is mainly due to transitory factors and should abate. Fed members expect no changes to the federal funds interest rate until 2023.
The yield on 10-year U.S. Treasuries fell for the third straight month, moving from 1.60% to 1.45%. As a result, bonds had modest positive performance in June.
Looking at market returns half way through 2021, equities had strong performance and bonds have held up reasonably well. However, there remains an unsustainable relationship between outperforming equities and near zero or negative real interest rates. Economic recovery and expansion will ultimately lead to higher interest rates which may provide challenges to future equity and bond returns.
Mid-Year Commentary
The strong stock market of the first half of 2021 can be attributed to two key factors:
- Significant progress in managing the virus through vaccinations and medical protocols leading to staged economic reopenings
- Unprecedented and ongoing monetary and fiscal stimulus policies
COVID-19 Progress
Both the number of cases and deaths have substantially declined in the U.S. The most recent CDC 7-day moving average reading of new cases was 12,514 compared to a high of 252,905 on January 10, 2021.
Internationally, some countries are experiencing spikes in the number of cases due, in part, to the more contagious delta variant. These countries include the United Kingdom, Russia, Philippines, Indonesia and Malaysia. Cases in India, which saw over 400,000 new cases as recently as May, have now fallen below 40,000 based on most recent data.
Spikes in geographic hot spots indicate human and economic risks from COVID-19 still exist. However, significant progress has been made and 2021 is a year of recovery. We are watching for when the National Bureau of Economic Recovery will officially date the end of the coronavirus recession in the U.S.
Monetary and Fiscal Stimulus
The U.S. economy is showing rapid growth. However, such growth has come from significant government spending including multiple rounds of stimulus checks. Such payments, coupled with upcoming IRS advance child tax credit payments for 2021, are being spent and the money is making its way into the economy. Further, the Federal Reserve has been “printing money” at a torrid pace. Its most recent quantitative easing (QE4) is now greater than the first three rounds of QE combined. Biden Administration proposals for infrastructure spending are also on the horizon.
The numbers are staggering. The Fed’s balance sheet now stands at about $8 trillion, almost double that of two years ago. We do not subscribe to modern monetary theory whereby the government can continue to print money without consequences. The federal budget has a spending level of about $6.8 trillion of which about $3 trillion is now borrowed.
These extreme measures have brought the country through the shutdown. However, as COVID-19 is defeated and the economy reopens, fiscal and the extremely loose monetary policy will end. The U.S. economy will need to stand on its own.
Employment and The “Next” Normal
Employment data associated with the economy reopening remains distorted by the uneven pandemic recovery. The 850,000 jobs added in June was reported as a “good” headline number. However, the June gains came especially from leisure, entertainment and day care, reflecting the lagging reopenings of shutdown industries. Job growth in the rest of the broader economy was weak or modest. In fact, construction jobs were down in June. Further, employment data showed the number of full-time jobs actually fell but were offset by more part-time jobs. Therefore, jobs data was choppy.
The current official unemployment rate is 5.9% compared to 3.5% in February 2020: a decline of 6.7 million jobs. The real question is what will happen to employment going forward and how many more jobs will be recovered. Restaurants, travel, hospitality and school jobs are just beginning to recover. The current trend in labor data seems to indicate the 6.7 million jobs gap will not be fully recovered any time soon.
We should see the post-pandemic workforce data in the next several months. It remains unclear what business sector or industry will lead jobs creation in the next economic cycle.
U.S. Inflation
A big question in 2021 is whether inflation will be mostly transitory or trend toward price levels that could impede economic growth. Headline CPI in May rose to 4.9%. However, the subindex CPI data was mixed. While CPI-Gasoline was at a very high 56.2%, CPI-Medical Care was low at 0.9%.
Vaccine rollout has changed consumer demand quickly. As businesses reopen, demand side price pressures are noticable. JP Morgan reports restaurant activity that was down 100% last year is now only 5% below prepandemic levels. Hotel occupancy that was down 69% is now down 10%. TSA traffic that was down 96% is now down 21%. Overall, consumer demand, as measured by debit/credit transactions, is up 23% over last year. Demand price pressures are evident. With demand rising, the supply of goods must increase to meet the greater demand.
Supply chains are being challenged, particularly if international trade is involved from regions still shutdown by the virus, such as parts of southeast Asia. Capacity constraints and supply bottlenecks may be expected to continue for a longer period of time. The demand and supply imbalances are affecting prices and pushing inflation higher.
While we think much of the inflation arising from the pandemic is transitiory, more persistent inflation concerns cannot be dismissed. Post-pandemic effects are impacting multiple industries. In energy, the demand for gasoline is increasing while U.S. production remains suppressed. Recent OPEC discord may delay further increases in foreign production. Shifting to the restaurant industry (CPI-Food Away From Home), it is costing more for owners to staff their establishments and to pay higher food costs. Menu prices are increasing. In other industries, impending tax increases to businesses could also prove inflationary. The Federal Reserve has indicated it will let inflation run “hot” to insure the economic recovery does not stall.
Overall, we expect a rising trend in inflation for a number of months that hopefully will subside as economic conditions normalize. Supply may take longer than people expect to meet consumer demand.
Investing in the Second Half of 2021
The investment markets are relatively calm. Equity volatility of the S&P 500, as measured by the VIX Index, is at a lower level of 15.83 compared to over 80 in March 2020. The yield on the 10-year Treasury has fallen modestly during the last three months. Portfolio returns are solid, especially coming out of a pandemic. The stock market has not had a downward correction in 2021 and it is relatively rare for corrections not to occur in a year.
While equity returns were generally strong in the first half of the year, it is less likely such returns can continue. Valuations for stocks are high. The forward price/earnings (P/E) ratio of the S&P 500 is 21.5 times earnings compared to a 25-year average of 16.7 times earnings. Historically, when stock market prices are higher, as they are now, subsequent five year returns are lower.
Valuations are inconsistent across S&P 500 companies. The top 10 companies have an average P/E ratio of 30.0 times earnings while the remaining companies are valued at 18.9 times earnings. S&P 500 corporate profit estimates are favorable and well above pre-pandemic levels.
Fixed income yields have fallen for the last 40 years and yields are very low. The 10-year Treasury yield on June 30 was 1.45% and the real yield, adjusted for inflation, was -2.35%. Falling yields are positive for bond prices, but with yields so low, fixed income could have muted future returns.
Because both equities and fixed income are expensive, we have preferred to recommend neutral, strategic allocations in this environment rather than a “full risk-on” approach. JMG recommends allocations to asset classes which are diversified and which have historically generated positive returns, after inflation. Real estate (REITs) and treasury inflation protected securities (TIPs) have done well with higher inflation.
As we move into the second half of 2021, we believe foreign developed and emerging market equities will perform better as overseas vaccine rollouts help those regions reopen. Also, foreign stock valuations are more favorable than U.S. valuations. Some expect the U.S. dollar to fall in value which would also lead to better foreign equity returns for U.S. investors.
We continue to closely monitor inflation data and potential effects on client portfolios. If you have any questions, you should consult with your JMG Advisor.
Important Disclosure
Please remember that past performance may not be indicative of future results. Different types of investments involve varying degrees of risk, and there can be no assurance that the future performance of any specific investment, investment strategy, or product made reference to directly or indirectly in this writing, will be profitable, equal any corresponding indicated historical performance level(s), or be suitable for your portfolio. Due to various factors, including changing market conditions, the content may no longer be reflective of current opinions or positions. Moreover, you should not assume that any discussion or information contained in this writing serves as the receipt of, or as a substitute for, personalized investment advice from JMG Financial Group, Ltd. To the extent that a reader has any questions regarding the applicability of any specific issue discussed above to his/her individual situation, he/she is encouraged to consult with the professional advisor of his/her choosing. JMG is neither a law firm nor a certified public accounting firm and no portion of the content provided in this writing should be construed as legal or accounting advice. A copy of JMG’s current written disclosure statement discussing advisory services and fees is available for review upon request.
To the extent provided in this writing, historical performance results for investment indices and/or categories have been provided for general comparison purposes only, and generally do not reflect the deduction of transaction and/or custodial charges, the deduction of an investment management fee, nor the impact of taxes, the incurrence of which would have the effect of decreasing historical performance results. It should not be assumed that your account holdings correspond directly to any comparative indices. Indices are not available for direct investment. Market Segment (index representation) as follows: U.S. Large Cap (S&P 500 Total Return); U.S. Mid-Cap (Russell Midcap Index Total Return); Foreign Developed (FTSE Developed Ex U.S. NR USD); Emerging Markets (FTSE Emerging NR USD); U.S. REITs (FTSE NAREIT Equity Total Return Index); Foreign REITs (FTSE EPRA/NAREIT Developed Real Estate Ex U.S. TR); U.S. Bonds (Bloomberg Barclays Capital U.S. Aggregate Index); U.S. TIPs (Bloomberg Barclays Capital U.S. Treasury: U.S. TIPs); Foreign Bonds (USD Hedged) (Bloomberg Barclays Capital Global Aggregate Ex U.S. TR Hedged); Municipal Bonds (Bloomberg Barclays Capital Municipal Bond Index); High Yield Bonds (Bloomberg Barclays Capital High Yield Index).