

A Look at Market Valuations
INVESTMENT COMMITTEE COMMENTARY October 2023
Stocks declined for the third straight month in October. Investor sentiment has declined in the last three months as recent inflation data demonstrated the challenges the Federal Reserve (Fed) faces in trying to bring down rising prices. The Consumer Price Index (CPI) and the Personal Consumption Expenditures (PCE) index remain well above the 2.0% target set by the Fed.
At its meeting on November 1st, the Fed held interest rates steady for the second straight time with the fed funds target rate remaining at 5.25% to 5.5%. The markets reacted positively to the Fed meeting and stocks rallied as investors viewed a possible end to the Fed rate hiking cycle.
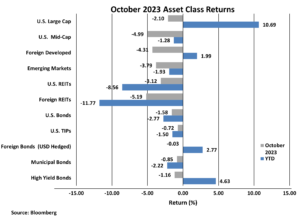
The S&P 500 fell 2.1% in October, but remains up 10.7% for the year. The yield on 10-year Treasuries rose from 4.57% to 4.88% and reached a high of 5.02% on October 23rd. This increase caused the Bloomberg U.S. Aggregate Bond Index to fall by 1.6% during the month. High yield bonds and foreign bonds (USD hedged) also declined in October, but year-to-date performance remains positive.
A Look at Market Valuations
High stock valuations are often cited as a top concern for investors. Valuations are calculated by various common metrics such as price-to-earnings, price-to-book value, price-to-cash flow or other intrinsic value approaches which broadly value a company based on the present value of expected future cash flows earned by a company. Valuation analysis can determine if stocks or stock indexes are above or below historical averages and may give an indication of expected future returns.
In considering valuations, it is important to know that low, attractive valuations do not necessarily predict strong short-term performance. How well do valuations predict tomorrow’s investment performance? Not at all. Valuations, however, have shown to provide some predictive value of returns over longer periods of time. “Buy low, sell high” works, but often requires a longer-term focus and discipline.
Currently, the largest seven stocks in the S&P 500 (known as the Magnificent Seven) have been driving performance. The chart below illustrates the relatively high valuations of these top seven stocks in the S&P 500 (Alphabet, Amazon, Apple, Meta, Microsoft, NVIDIA and Tesla) as measured by their aggregate price-to-book value (P/B) ratio.
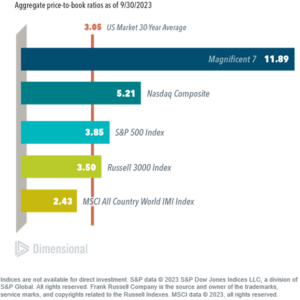
History tells us that the Magnificent Seven will not be able to sustain the level of recent returns and stock growth. Six of the companies in the Magnificent Seven have lower profitability levels than the average company in the S&P 500. Most other stocks are trading at levels around their 30-year average. We believe it is prudent to keep portfolios broadly diversified and allocated to asset classes with lower relative valuations such as mid and small cap US stocks and foreign stocks.
If you have any questions, please consult your JMG Advisor.
Important Disclosure
Please remember that past performance may not be indicative of future results. Different types of investments involve varying degrees of risk, and there can be no assurance that the future performance of any specific investment, investment strategy, or product (including the investments and/or investment strategies recommended or undertaken by JMG Financial Group Ltd. (“JMG”), or any non-investment related content, made reference to directly or indirectly in this writing will be profitable, equal any corresponding indicated historical performance level(s), be suitable for your portfolio or individual situation, or prove successful. Due to various factors, including changing market conditions and/or applicable laws, the content may no longer be reflective of current opinions or positions. Moreover, you should not assume that any discussion or information contained in this writing serves as the receipt of, or as a substitute for, personalized investment advice from JMG. To the extent that a reader has any questions regarding the applicability of any specific issue discussed above to his/her individual situation, he/she is encouraged to consult with the professional advisor of his/her choosing. JMG is neither a law firm, nor a certified public accounting firm, and no portion of the content provided in this writing should be construed as legal or accounting advice. A copy of JMG’s current written disclosure Brochure discussing our advisory services and fees is available upon request. If you are a JMG client, please remember to contact JMG, in writing, if there are any changes in your personal/financial situation or investment objectives for the purpose of reviewing/evaluating/revising our previous recommendations and/or services, or if you would like to impose, add, or to modify any reasonable restrictions to our investment advisory services. JMG shall continue to rely on the accuracy of information that you have provided.
To the extent provided in this writing, historical performance results for investment indices and/or categories have been provided for general comparison purposes only, and generally do not reflect the deduction of transaction and/or custodial charges, the deduction of an investment management fee, nor the impact of taxes, the incurrence of which would have the effect of decreasing historical performance results. It should not be assumed that your account holdings correspond directly to any comparative indices. Indices are not available for direct investment.
Market Segment (index representation) as follows: U.S. Large Cap (S&P Total Return); U.S. Mid-Cap (Russell Midcap Index Total Return); Foreign Developed (FTSE Developed Ex U.S. NR USD); Emerging Markets (FTSE Emerging NR USD); U.S. REITs (FTSE NAREIT Equity Total Return Index); Foreign REITs (FTSE EPRA/NAREIT Developed Real Estate Ex U.S. TR); U.S Bonds (Bloomberg US Aggregate Bond Index); U.S. TIPs (Bloomberg US Treasury Inflation-Linked Bond Index); Foreign Bond (USD Hedged) (Bloomberg Global Aggregate Ex US TR Hedged); Municipal Bonds (Bloomberg US Municipal Bond Index); High Yield Bonds (Bloomberg US Corporate High Yield Index).