
Monthly Economic News
Monthly Economic News
Short Term Pains, Long Term Gains
INVESTMENT COMMITTEE COMMENTARY MARCH 2021
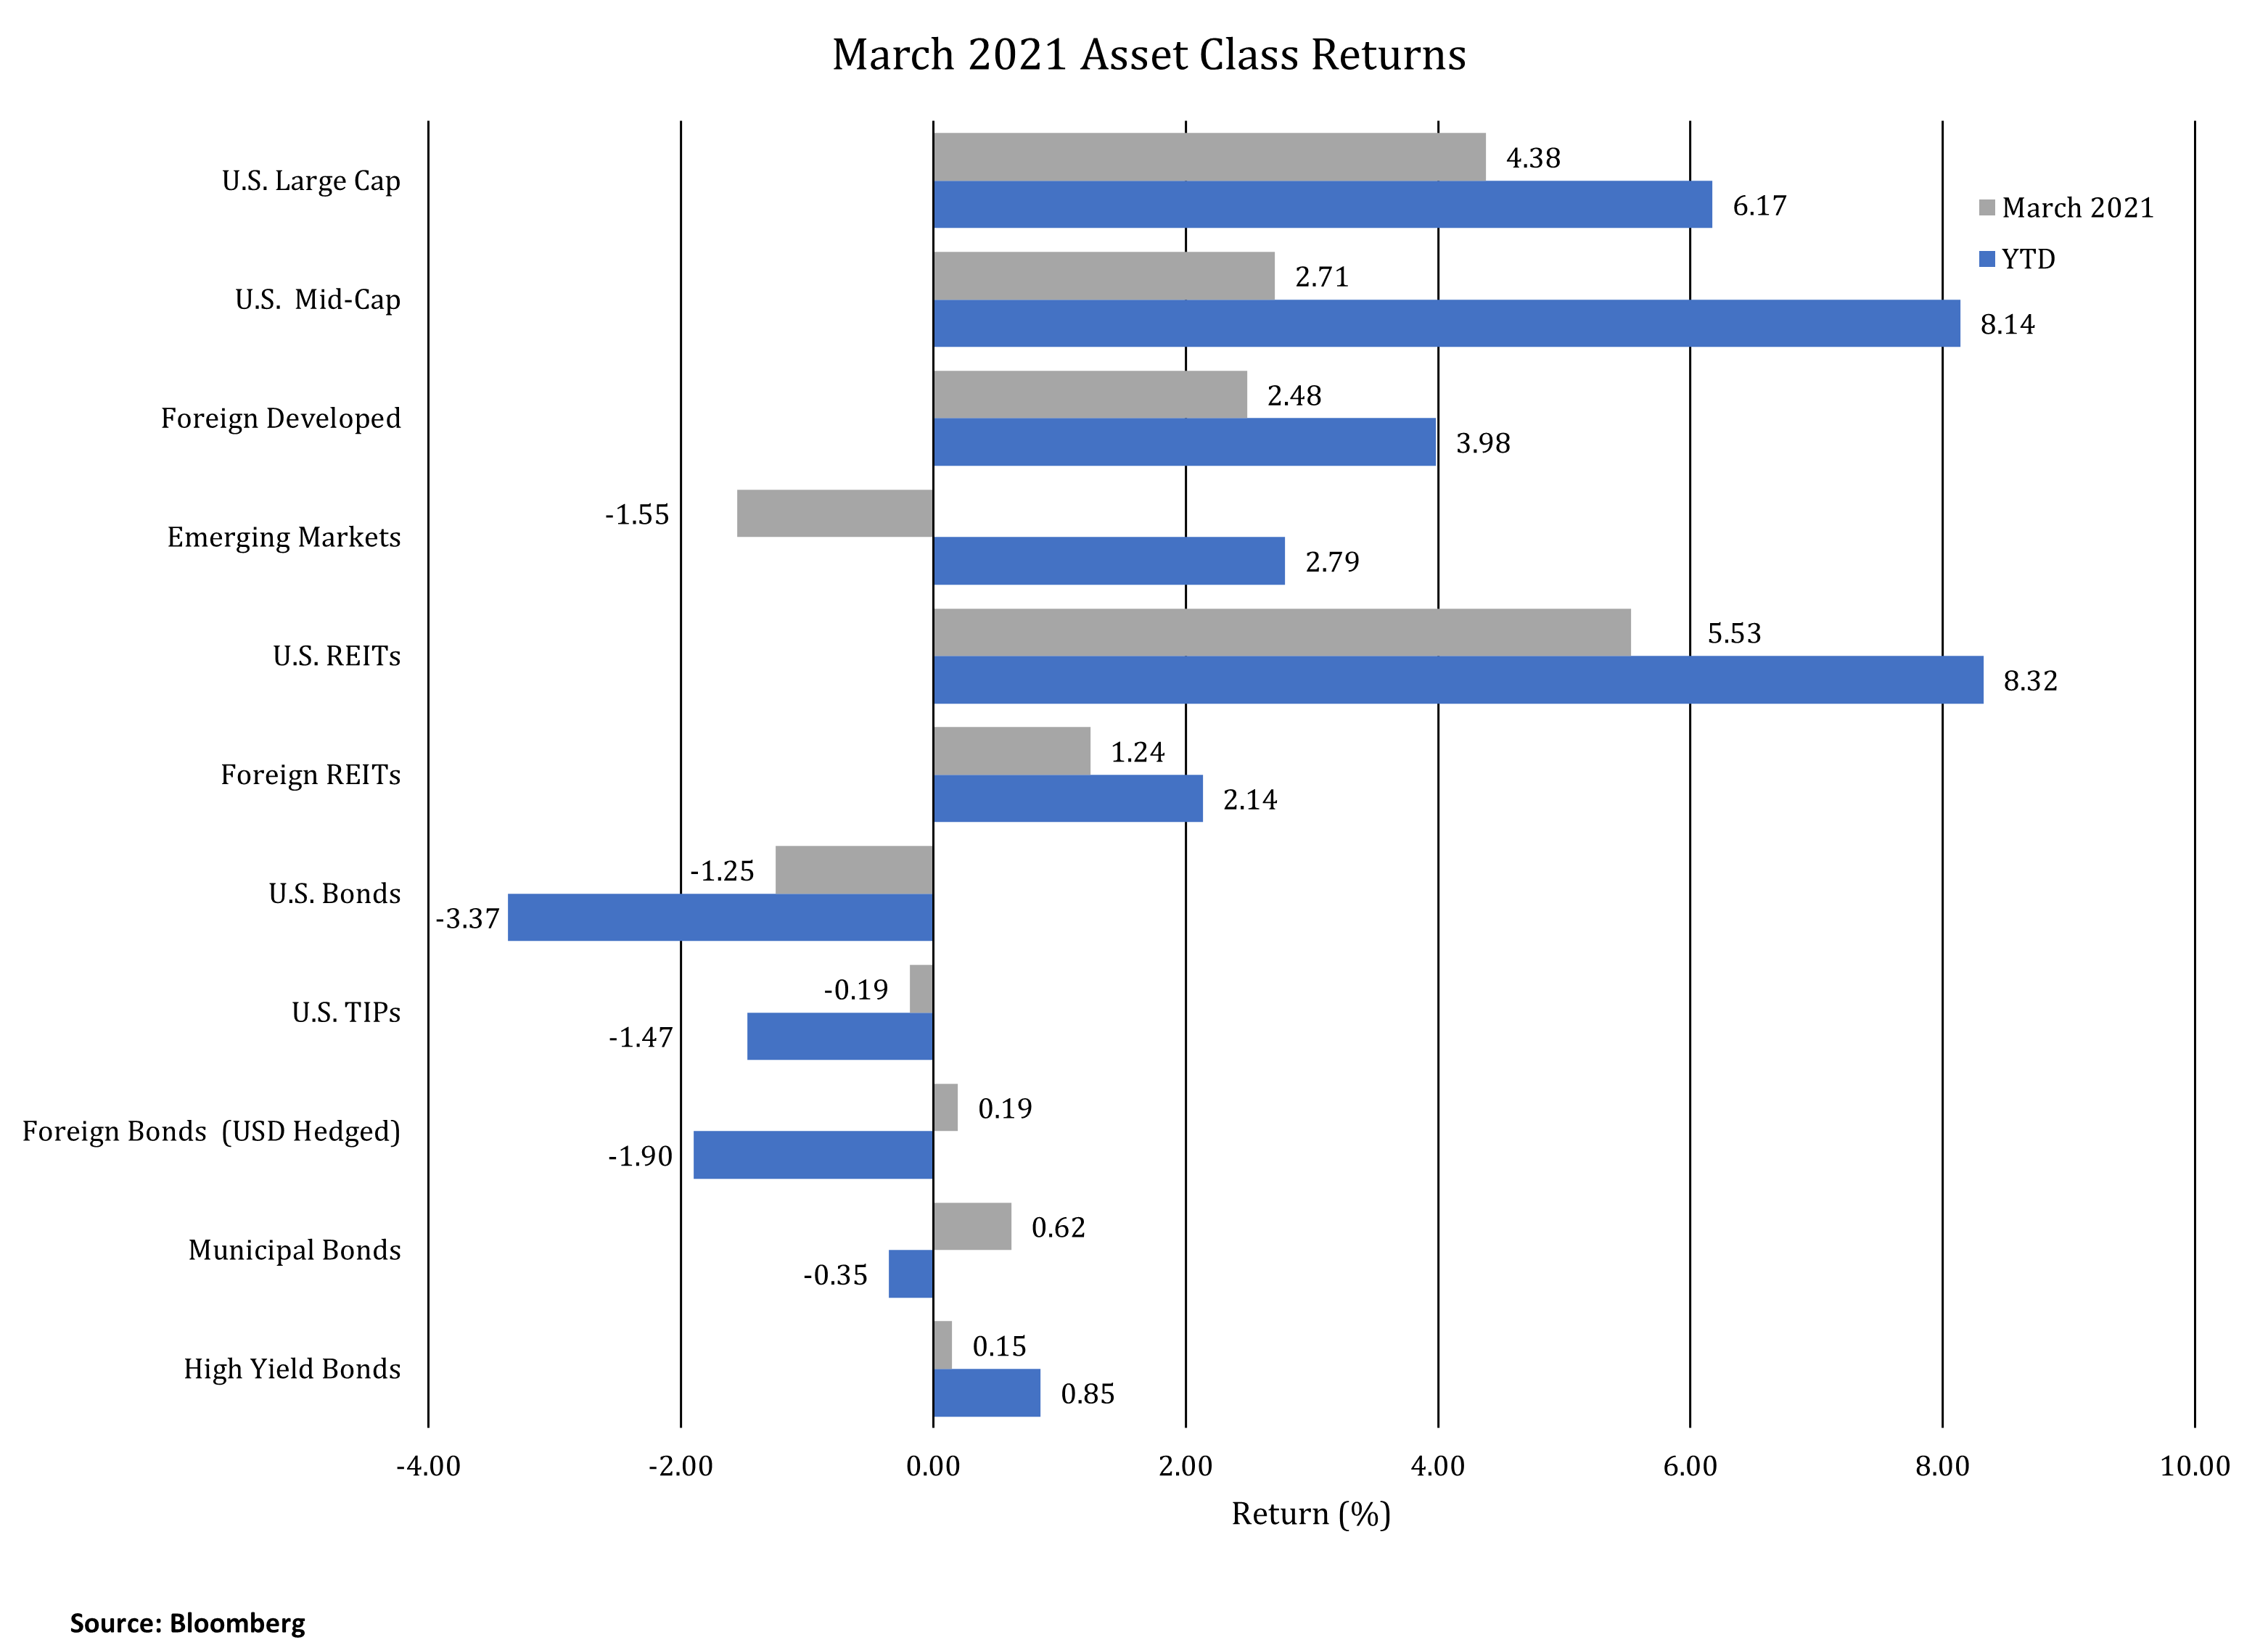
Performance was generally positive in March except for emerging market equities and U.S. bonds. Stocks were favored by investors as COVID-19 vaccines became available to many more people. Equity markets also looked toward easing COVID restrictions, continued accommodation by central banks, and fiscal stimulus measures supporting the economy in the short-term as the country continues to emerge from the COVID-19 crisis.
A key factor for performance in the first quarter was the faster than expected rise in longer-term interest rates. Interest rates, which fell in 2020, reversed direction with increased growth expectations for the U.S economy. The yield on 10-year Treasuries rose by 0.81% in the first quarter resulting in a decrease in bond prices and accounting for the worst quarterly performance for the U.S. Aggregate Bond Index since 1981. Municipal bonds and high yield bonds had positive performance in March with better relative performance compared to the U.S. Aggregate Bond Index.
Several JMG clients have asked about U.S. inflation. We are monitoring the components of inflation, but inflation is difficult to predict. To truly analyze inflation, one needs to understand why prices are rising. It could be supply-related, demand-related, or both simultaneously. Price movement may also result from regulation and tariffs. Increases in producer prices may or may not be passed on to consumers. However, certain price increases to consumers can be significant. For example, home builders are dealing with lumber prices that have skyrocketed by 180% over the last year.
We are seeing multiple economists with predictions of a short-term rise in inflation. However, there appears to be a low probability of imminent runaway inflation. We do expect headline inflation to show higher readings as we move through 2021. A principal reason is the price of gasoline. In January 2021, headline CPI rose 1.8%, but excluding gasoline, the CPI would have been 1.4%. Gasoline, which contributed to reduced inflation in 2020, will likely have the opposite effect in 2021.
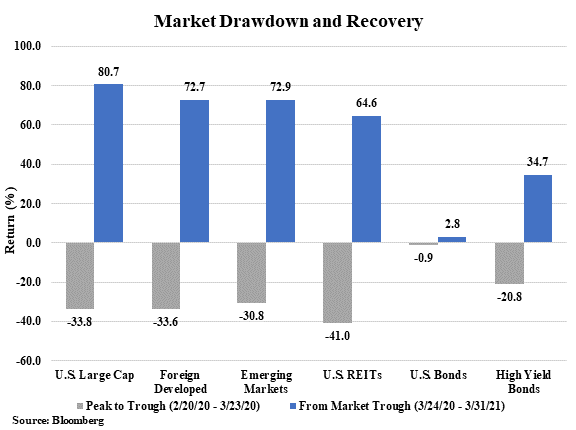
It has now been a year since the dramatic stock market decline precipitated by the COVID-19 economic shutdowns. With hindsight, the periods of market drawdown and recovery were the fastest in history. The market peak before the economic shutdowns occurred on February 20th. Over the next 32 days, stocks fell by over 30% reaching a low on March 23rd. Several factors provided a catalyst to reverse the falling stock market, including Federal Reserve intervention, large and rapid fiscal stimulus and recognition by the market that not all companies would be negatively impacted by COVID. The chart below shows the dramatic decline and subsequent market recovery over the last year through March 31, 2021.
At JMG, we believe in a disciplined approach to investing. The volatility of the last year could not be accurately predicted. However, maintaining a targeted asset allocation appropriate for individual circumstances, and adhering to those targets, allows one to manage through such uncertain periods. The volatility allows for rebalancing opportunities (buy low / sell high) and for the tax management of capital gains / losses. The chart below shows that over time, positive investment returns can be earned even through volatile and unpredictable periods. While difficult to execute, investors may earn the best returns by investing when others are panic selling. Further, investors can lock in returns by selling in outperforming markets when other investors are willing to pay high prices for already overbought stocks. Profitable and disciplined investment decisions are often uncomfortable in the moment.
If you have any questions, please contact your JMG advisor.
Important Disclosure
Please remember that past performance may not be indicative of future results. Different types of investments involve varying degrees of risk, and there can be no assurance that the future performance of any specific investment, investment strategy, or product made reference to directly or indirectly in this writing, will be profitable, equal any corresponding indicated historical performance level(s), or be suitable for your portfolio. Due to various factors, including changing market conditions, the content may no longer be reflective of current opinions or positions. Moreover, you should not assume that any discussion or information contained in this writing serves as the receipt of, or as a substitute for, personalized investment advice from JMG Financial Group, Ltd. To the extent that a reader has any questions regarding the applicability of any specific issue discussed above to his/her individual situation, he/she is encouraged to consult with the professional advisor of his/her choosing. JMG is neither a law firm nor a certified public accounting firm and no portion of the content provided in this writing should be construed as legal or accounting advice. A copy of JMG’s current written disclosure statement discussing advisory services and fees is available for review upon request.
To the extent provided in this writing, historical performance results for investment indices and/or categories have been provided for general comparison purposes only, and generally do not reflect the deduction of transaction and/or custodial charges, the deduction of an investment management fee, nor the impact of taxes, the incurrence of which would have the effect of decreasing historical performance results. It should not be assumed that your account holdings correspond directly to any comparative indices. Indices are not available for direct investment. Market Segment (index representation) as follows: U.S. Large Cap (S&P 500 Total Return); U.S. Mid-Cap (Russell Midcap Index Total Return); Foreign Developed (FTSE Developed Ex U.S. NR USD); Emerging Markets (FTSE Emerging NR USD); U.S. REITs (FTSE NAREIT Equity Total Return Index); Foreign REITs (FTSE EPRA/NAREIT Developed Real Estate Ex U.S. TR); U.S. Bonds (Bloomberg Barclays Capital U.S. Aggregate Index); U.S. TIPs (Bloomberg Barclays Capital U.S. Treasury: U.S. TIPs); Foreign Bonds (USD Hedged) (Bloomberg Barclays Capital Global Aggregate Ex U.S. TR Hedged); Municipal Bonds (Bloomberg Barclays Capital Municipal Bond Index); High Yield Bonds (Bloomberg Barclays Capital High Yield Index).