

Looking Forward
INVESTMENT COMMITTEE COMMENTARY September 2022
Inflation remains stubbornly high but there are signs the rate of increase is peaking. Supply chain problems are being resolved, inventories are building, and slower economic growth is weakening demand pressures. The price of crude oil is down more than 30% from the June high and several key commodity prices have returned to pre-covid levels.
Equity and bond markets became more convinced that The Federal Reserve (Fed) will follow through with their stated intention to raise the federal funds rate target by another 1.0-1.5% above September levels. With its dual mandate of stable prices and maximum employment, the Fed may be forced to continue to raise interest rates to combat inflation as long as the labor market remains near full employment. The eventual outcome will likely be a U.S. recession. Globally, foreign central banks are also moving toward more restrictive monetary policies. However, global economic growth has slowed to a standstill. Purchasing Managers Indexes for both developed and emerging economies peaked in the spring and have been in a downtrend through the summer. The result is that both stock and bond prices have fallen sharply as there is more uncertainty as to the depth and length of the current economic slowdown.
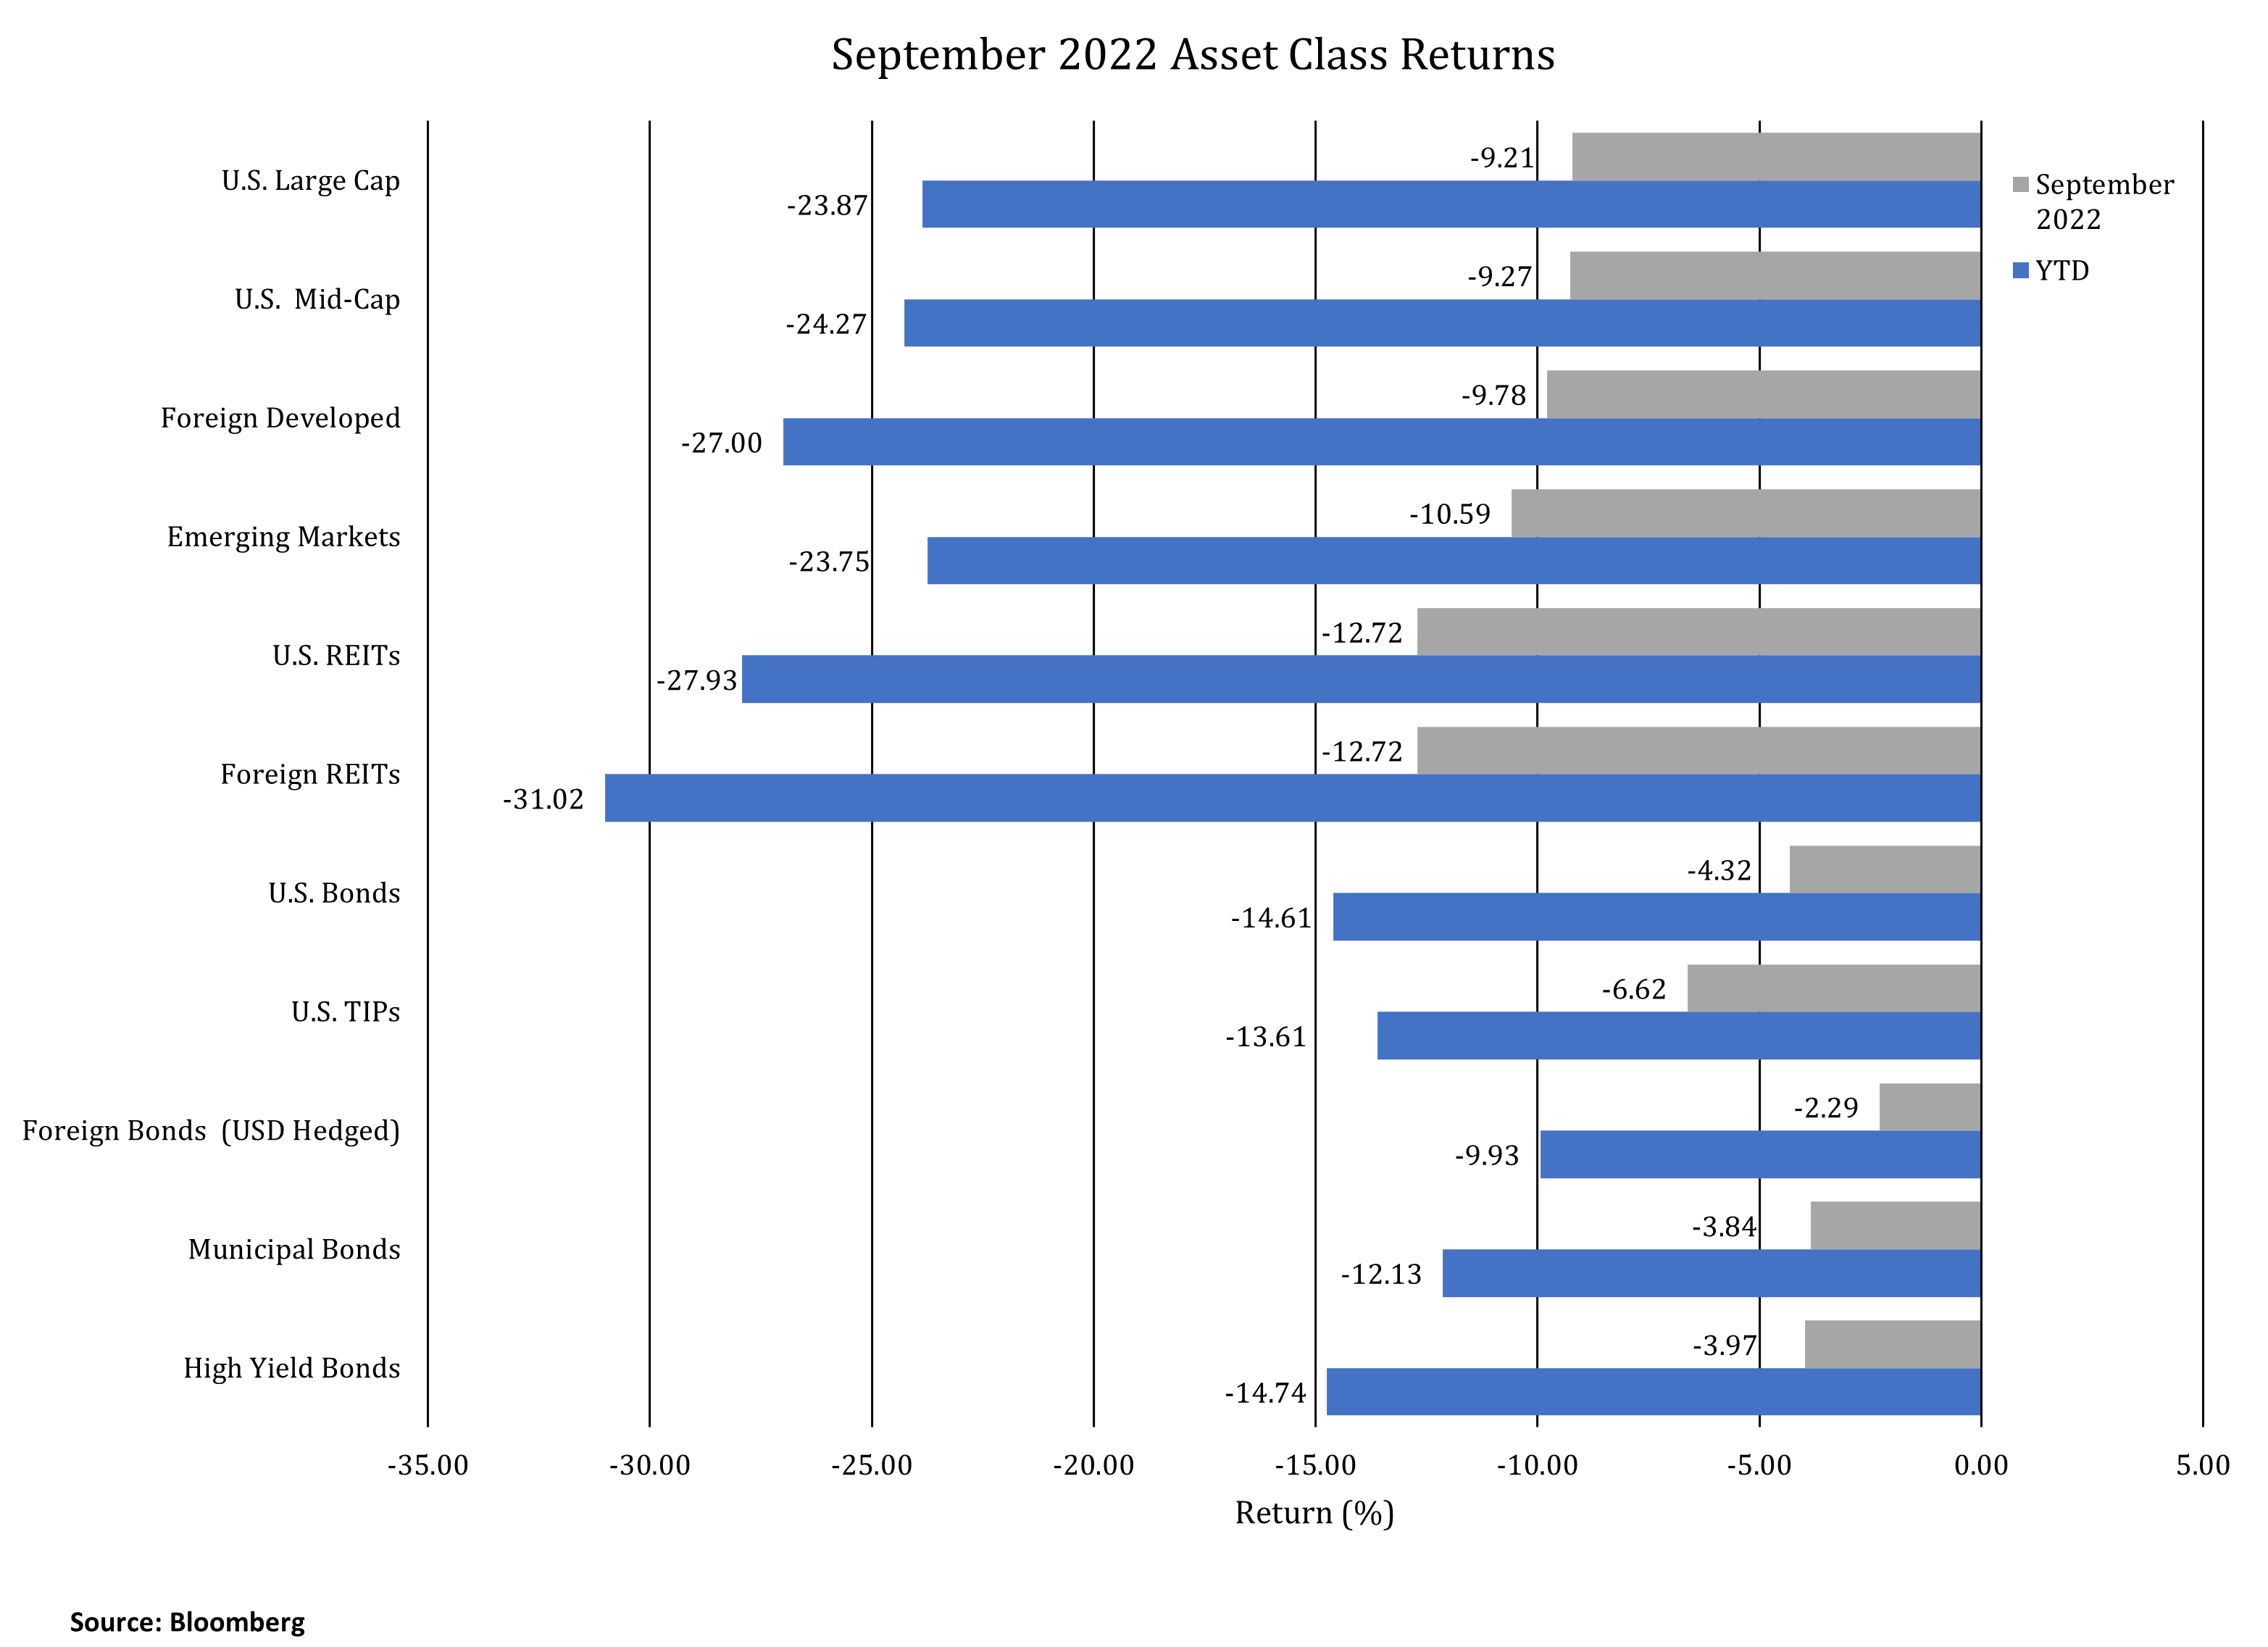
In September, the S&P 500, foreign developed equities and emerging market equities fell 9.2%, 9.8%, and 10.6%, respectively. Real estate investment trusts (REITs) were down 12.7%. For the month, the yield on 10-year Treasuries rose from 3.13% to 3.81%. As a result, intermediate investment grade bonds fell 4.3%.
 Looking Forward
This year’s market downturn has been particularly difficult because it is widespread across both stocks and bonds. As stocks and bonds have declined in tandem, typical portfolio rebalancing opportunities are not presenting themselves. This is not unprecedented, but it is extremely rare, as bonds have been reacting to quickly shifting Fed policy that is now very different than what was outlined just one year ago (Remember the Fed’s “lower for longer” interest rate guidance?).
Before looking at the prospects going forward, it is helpful to compare this year’s downturn to the market downturn of 1973. In 1973 a severe recession led to a bear market that carried well into 1974. While we caution against precise comparisons of 2022 to other periods, studying history reminds us of important lessons learned from those periods.
Looking at 1973, we saw dual market shocks that occurred against the backdrop of the Vietnam War and the President Nixon/Watergate controversy. In the first shock, crop failure in the Soviet Union and associated government responses created grain shortages causing food prices to skyrocket. The second shock was the OPEC oil embargo which sent oil prices higher. Inflation was already running high, and the oil crisis exacerbated it. In its 1974 Annual Report, the Investment Company of America (ICA) wrote of investor sentiment at the time:
“The problems that have depressed the market are well known: double-digit inflation, a deepening recession, international monetary uncertainties and the explosive situation in the Middle East. These have all contributed to the biggest problem — a general erosion of confidence. This has been reflected not only in the stock market but in the overall economy. Many individuals have been so disillusioned by political and economic events and by their investment experiences that they have convinced themselves that stock prices will never go up again.”
The ICA’s comments could have been written today. The recovery from the inflationary period of the seventies was long and painful, but the markets did recover. Dimensional Fund Advisors provides the following chart showing the growth of equities from 1970. This period includes all kinds of economic and global events: inflation, stagflation, rising and falling interest rates, wars, and natural disasters. In spite of these events, the longer-term trend line continued upward.
From the time ICA wrote in 1973 that people were convinced stocks would never rise again, $1 invested had almost a hundred-fold increase by 2022, albeit with bumps along the way.
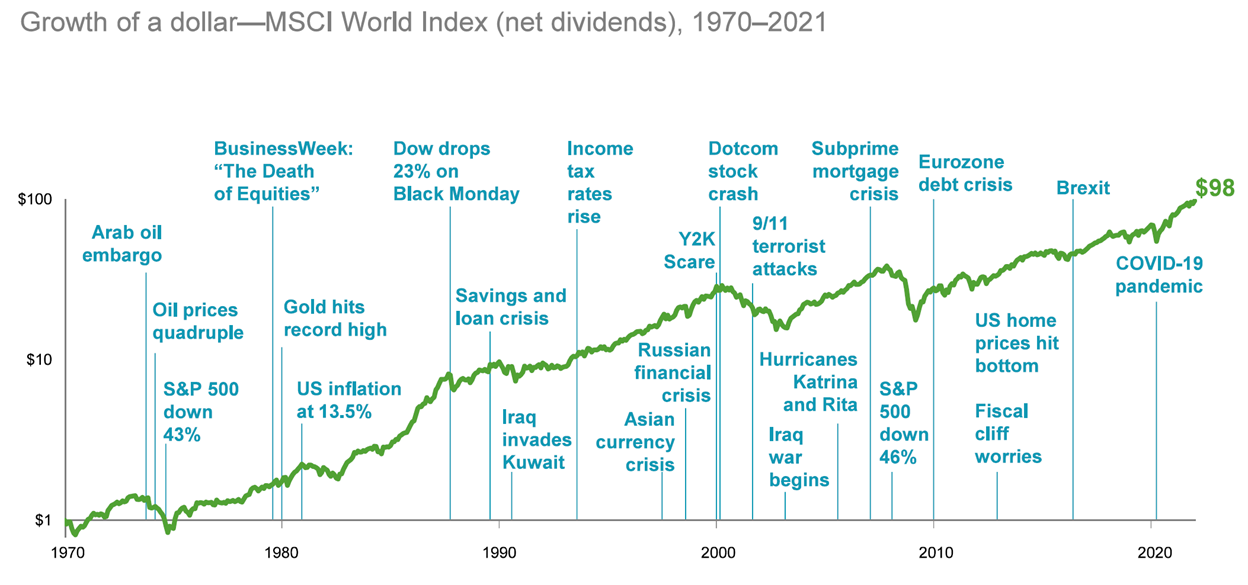
![]()
When stock and bond prices are depressed, forward-looking returns are more attractive. The following chart from JP Morgan illustrates the returns required for the S&P 500 to recover to its market high of 4,797 from January 2022. From September 30th levels, even if it takes five years to recover, the annualized forward return would be 7.9%. A shorter recovery would generate more attractive returns. Because the stock market is forward-looking, it will begin its recovery ahead of the economy.
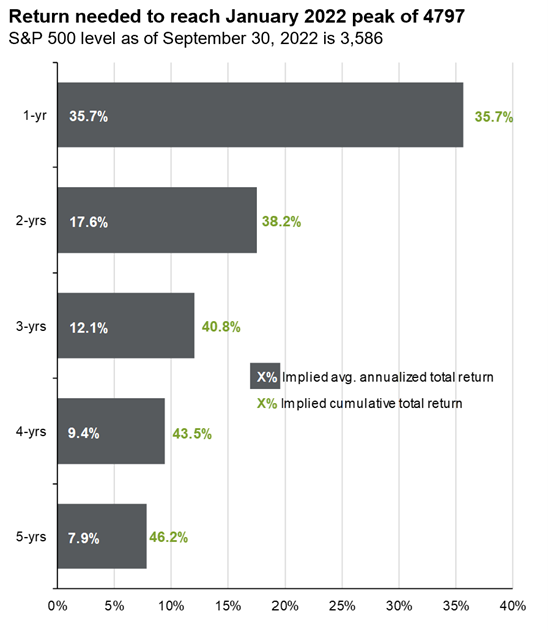 Source: JP Morgan Guide to the Markets
Forward stock valuation multiples are now below 25-year averages. While corporate earnings growth has slowed, earnings continue to increase at a pace of 5.8% year-to-date.
Bond recoveries are more predictable than an equity market recovery. Yields have more than doubled this year, which will translate into higher returns going forward. Our fixed income managers are taking advantage of these higher yields and making portfolio adjustments.
As market concerns shift away from inflation and towards the outlook for economic growth, we believe the benefits of diversification among stocks and bonds will become prevalent. The most opportune time to invest is when investor sentiment is low and markets are depressed with investor fear. Following a predetermined asset allocation strategy should help take advantage of market opportunities without taking on unintended risk. Although we will continue to look for tactical opportunities created by the market sell-off, we will only take such action if there is sufficient conviction.
If you have any questions, you should consult with your JMG Advisor.
Important Disclosure
Please remember that past performance may not be indicative of future results. Different types of investments involve varying degrees of risk, and there can be no assurance that the future performance of any specific investment, investment strategy, or product (including the investments and/or investment strategies recommended or undertaken by JMG Financial Group Ltd. (“JMG”), or any non-investment related content, made reference to directly or indirectly in this writing will be profitable, equal any corresponding indicated historical performance level(s), be suitable for your portfolio or individual situation, or prove successful. Due to various factors, including changing market conditions and/or applicable laws, the content may no longer be reflective of current opinions or positions. Moreover, you should not assume that any discussion or information contained in this writing serves as the receipt of, or as a substitute for, personalized investment advice from JMG. To the extent that a reader has any questions regarding the applicability of any specific issue discussed above to his/her individual situation, he/she is encouraged to consult with the professional advisor of his/her choosing. JMG is neither a law firm, nor a certified public accounting firm, and no portion of the content provided in this writing should be construed as legal or accounting advice. A copy of JMG’s current written disclosure Brochure discussing our advisory services and fees is available upon request. If you are a JMG client, please remember to contact JMG, in writing, if there are any changes in your personal/financial situation or investment objectives for the purpose of reviewing/evaluating/revising our previous recommendations and/or services, or if you would like to impose, add, or to modify any reasonable restrictions to our investment advisory services. JMG shall continue to rely on the accuracy of information that you have provided.
To the extent provided in this writing, historical performance results for investment indices and/or categories have been provided for general comparison purposes only, and generally do not reflect the deduction of transaction and/or custodial charges, the deduction of an investment management fee, nor the impact of taxes, the incurrence of which would have the effect of decreasing historical performance results. It should not be assumed that your account holdings correspond directly to any comparative indices. Indices are not available for direct investment. Market Segment (index representation) as follows: U.S. Large Cap (S&P Total Return); U.S. Mid-Cap (Russell Midcap Index Total Return); Foreign Developed (FTSE Developed Ex U.S. NR USD); Emerging Markets (FTSE Emerging NR USD); U.S. REITs (FTSE NAREIT Equity Total Return Index); Foreign REITs (FTSE EPRA/NAREIT Developed Real Estate Ex U.S. TR); U.S Bonds (Bloomberg US Aggregate Bond Index); U.S. TIPs (Bloomberg US Treasury Inflation-Linked Bond Index); Foreign Bond (USD Hedged) (Bloomberg Global Aggregate Ex US TR Hedged); Municipal Bonds (Bloomberg US Municipal Bond Index); High Yield Bonds (Bloomberg US Corporate High Yield Index).