Advisor Perspective
Advisor Perspective
JMG’s Investment Process, Designed Around You (Part 2 – Portfolio Design)
By Bill German, Chief Investment Officer, Principal, CFP® and John White, Principal, CFA, CFP®
This article is the second in a four-part series. In the previous article we discussed the overall investment process and the first step in the process, Client Analysis. Today we will discuss the second step in our process, Portfolio Design, in which your advisor, with guidance from JMG’s Investment Committee, determines the mix of asset classes that will best support your plan, seeking the optimal balance of risk and return based on your circumstances.
Our next article will cover Investment Selection the process your advisor uses to choose the specific investments you will hold in your portfolio.
Portfolio Design
A client’s portfolio is an essential part of any financial plan. Like a car engine, portfolio growth provides power to the plan, but for it to be effective it must integrate with the plan so that the power generated transfers efficiently towards the client’s financial goals.
Our goal in Portfolio Design is to establish an asset allocation which will support the return requirements of your plan, while mitigating risks.
Planning considerations when designing portfolios include:
- Portfolio Returns – We seek to ensure that the portfolio expected return is sufficient to meet client financial objectives.
- Portfolio Risk – We determine whether the required returns can be achieved at an acceptable level of risk. If not, we must revisit the plan to reduce the required return or reconsider the amount of risk we are willing to accept.
- Client Preferences – We work with clients to determine any specific restrictions they would like us to consider when designing the portfolio.
Once your advisor understands these considerations, he or she commemorates how your portfolio will be managed and why in your Investment Policy Statement. Once the Investment Policy Statement has been established, your advisor completes the remaining portfolio design:
- Portfolio Asset Classes – The Investment Committee provides guidance on how to break down the investment universe into distinct asset classes which will serve as building blocks for your portfolio.
- Portfolio Asset Allocation – Starting with models provided by the Investment Committee, and adjusting the portfolio for your specific situation, your advisor establishes a target weight for each asset class in your portfolio.
Together, these make up your target asset allocation, which serves as a template for implementing your portfolio during Step 3: Investment Selection when your advisor determines your specific portfolio investments.
For now, let us focus on how your advisor selects your target asset allocation, and why.
Risk Management and Investor Behavior
Investing is an inherently emotional experience, with ups and downs as markets move. These emotions can impact a client’s long-term wealth when acted upon inappropriately. This usually takes the form of either (a) buying at the top of the market, when emotions are high, or (b) selling at the bottom when some crisis has caused them to lose their nerve.

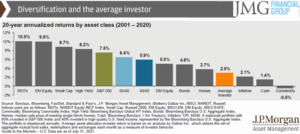
As a result of poor timing decisions, driven by emotions, many investors not only underperform market benchmarks, but underperform their own investments. This can be seen in the chart below in the period 2001-2020, when the average investor underperformed not just the equity market, but blended portfolios of equities and bonds.

When building your portfolio, we seek to take enough risk to provide your plan’s required return but not so much risk that you will be unable to maintain the strategy through a down market. Your advisor works with you to understand your goals and tolerance for risk, so you can together determine an appropriate balance between equities and fixed income – officially referred to you as your “strategic asset allocation” – which is memorialized in your Investment Policy Statement.
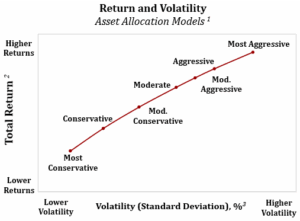
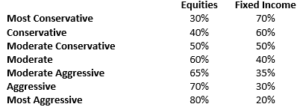
To provide a framework for advisors and their clients, the Investment Committee has established a range of asset allocations which serve as inputs into your advisor’s portfolio design. The asset allocations range from the Most Conservative (30% equity/70% fixed income) to Most Aggressive (80% equity/20% fixed income). Based on these varying levels of equity and fixed income, these asset allocation models produce a range of risk and return outcomes, as can be seen in the following chart.

Client Preferences
Ultimately, the most important part of Portfolio Design is ensuring that your portfolio is aligned with your plan. To evaluate this, our advisors consider the following factors, referred to as the “TREAT” acronym:
- Time Horizon – How long will it be until you need to access the funds in your portfolio? How long will you need your assets to last?
- Risk Tolerance – There are two parts to this: willingness and ability to accept risk. Is your plan able to withstand a significant drop in portfolio value? Are you willing to experience a steep drop in your portfolio without selling at the bottom?
- Expected Return – What expected return is required to make your plan successful, i.e. for you to achieve your financial goals?
- Asset Class Preferences – Are you restricted in buying or selling your company’s stock? Do you have significant investments in your company retirement plan or elsewhere that should be contemplated in designing JMG’s allocation?
- Tax Considerations – What are the tax exposures that are already embedded in your portfolio? What is your current tax rate? Is your estate likely to be subject to estate tax?
Your advisor reevaluates your Investment Policy from time to time, and when any of these elements change, he or she may update your Investment Policy Statement if it makes sense to do so. It is worth noting, we do not recommend adjusting your Investment Policy simply because the market has gone up or down or because something in the economy has changed.
Accumulation vs Decumulation – Sequence of Returns Risk
One essential consideration related to your Time Horizon when determining your strategic asset allocation is whether, when, and how much you intend to draw on your portfolio. This is due to the differential impacts of volatility when you are buying vs when you are selling.
When you are in your working years, and are accumulating assets through savings, volatility may be your friend. This is because when you buy shares which have dropped in price you get more shares for your dollar than when prices are higher.
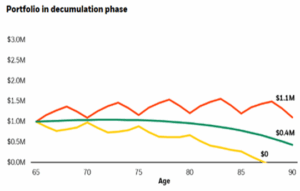
In contrast, when you retire and begin to draw on your portfolio, referred to as decumulating your assets, how you experience volatility matters and volatility may be detrimental because if you sell assets when the markets are down early in your retirement, you must sell a larger percentage of your portfolio which reduces your ability to recover. This is demonstrated in the modeled performance below which compares the performance of three portfolios with the same starting value and the same average returns, but which differ in their sequence of returns.
- Portfolio A has strong initial performance followed by weak performance.
- Portfolio B has a steady 7% return.
- Portfolio C has poor initial performance followed by stronger performance.
Note in the second chart how Portfolio C’s asset value declines more than the other two.


As a result, clients who plan to draw on their portfolios require more attention to risk management than clients who are saving or accumulating assets.
Breaking Down the Portfolio – Sub-Asset Classes
In supporting your advisor as he or she designs your portfolio, our Investment Committee provides portfolio allocation guidance. In doing so, the Investment Committee utilizes a global and broadly diversified approach in evaluating the major asset classes (i.e., equities and bonds), while also breaking down those major asset classes into sub-asset classes, such as large-cap and mid-cap U.S. equities, investment grade and high-yield bonds, or real estate equities to name a few. We review this list of asset classes and adjust it from time to time. For example, we have previously invested in commodities, but do not currently include commodities in our portfolios.
JMG’s Investment Committee designs our strategic portfolio allocations with several built-in biases relative to a simple global market-weighted portfolio allocation.
- We maintain a “Home Country Bias,” that is, our client portfolios are typically overweight U.S. assets, since you probably live in the United States and spend U.S. Dollars most of the time.
- Within this U.S. bias, we overweight mid-cap stocks, since over long periods of time, mid-cap stocks have historically similar returns to small-caps with less volatility. However, from time to time when market conditions indicate there is an opportunity, we make a tactical allocation to small-caps.
- We invest in non-U.S. equities and non-U.S. fixed income – albeit for different reasons.
-
- In equity markets, we have observed that the U.S. market goes through cycles of over and under performance relative to non-US markets. While there are many factors at play, one important driver of this has been fluctuations in the U.S. dollar. By investing in non-U.S. assets, we get access to a broader universe of companies and potentially benefit when foreign currencies rally.
- For non-U.S. Bonds, we are looking for stability and diversification. As a result, we typically use dollar-hedged foreign bonds, so that we can benefit from credit diversification, without the unwanted volatility of currencies within our bond allocation.
- While many U.S. stock market indexes added real estate several years ago, the global real estate market is extremely large, and we believe clients tend to be underexposed to commercial real estate. We therefore maintain an additional allocation to global real estate assets.
The Right Private Investments for the Right Clients
For clients who are eligible, we consider whether investments in private markets makes sense for inclusion in the portfolio. Public markets have the advantage that they are liquid, transparent, relatively easy to understand, and can be accessed at a very low cost. Public markets also have substantial return histories and manager performance tends to reflect their universe of investments, which makes them relatively predictable over long periods of time.
Private markets, and alternative investments more broadly, range from return enhancing strategies like Private Equity or Private Debt, to risk-reducing/diversifying strategies, like Hedge Funds. These tend to be illiquid, higher cost, and the risk/return expectations vary widely, even across what may appear to be similar strategies, so it is essential to understand the specific characteristics of the managers and strategies used. We may use Private market investments to augment your portfolio, where the return enhancement or risk mitigation are compelling, and can be implemented in a way which fits within your goals and investment objectives.
Summary
In designing your portfolio, your advisor works with you to determine your strategic asset allocation and memorializes this in your Investment Policy Statement. Then, using asset allocation frameworks provided by JMG’s Investment Committee, your advisor allocates your portfolio to sub-asset classes, adjusting the weights as appropriate to your circumstances. If it makes sense, your advisor may enhance your portfolio by making allocations to alternative investments.
In our next article, we will describe how your advisor, with counsel from our Investment Committee, selects the specific securities to fulfill your portfolio allocation. Investment Selection is step three of our process.
If you have any questions about this process, please reach out to your financial advisor.
Important Disclosure
1 Asset Allocation weightings are based on an allocation of equities and fixed income, rebalanced monthly. As follows:

-
Equities are represented by S&P 500 Total Return Index. The S&P 500 Index is recognized as a benchmark for U.S. large cap stocks. Prior to January 1st, 2024, Equities are represented by the Ibbotson Associates (IA) Stocks, Bonds, Bills, and Inflation (SBBI) Total Return (TR) series (IA SBBI US Large Stock TR).
-
Fixed Income is represented by Bloomberg U.S. Aggregate Bond index, which is recognized as a broad-based benchmark for U.S. investment grade bonds. Prior to January 1st, 2024, Fixed Income is represented by Ibbotson Associates (IA) Stocks, Bonds, Bills, and Inflation (SBBI) Intermediate (IT) Government (Govt) Total Return (TR) index, which is also known as IA SBBI US IT Govt TR USD. This index consists of U.S. intermediate-term (i.e. 5-year) government bonds.
2 Annual Return – Time-Weighted Return (TWR) – computes the annualized total return of an investment portfolio over a designated holding period, rebalanced monthly. TWR is a generally accepted method for determining investment performance because the investment manager does not control the timing when an investor adds or withdraws funds from an investment account.
3 Annual Volatility is expressed by the annualized standard deviation (normally distributed). Standard deviation is a statistic that measures the volatility (dispersion) of total return from the average (mean) value, generally calculated based on monthly returns. The higher the standard deviation, the more volatile the expected return.
Please remember that past performance may not be indicative of future results. Different types of investments involve varying degrees of risk, and there can be no assurance that the future performance of any specific investment, investment strategy, or product (including the investments and/or investment strategies recommended or undertaken by JMG Financial Group Ltd. (“JMG”), or any non-investment related content, made reference to directly or indirectly in this writing will be profitable, equal any corresponding indicated historical performance level(s), be suitable for your portfolio or individual situation, or prove successful. Due to various factors, including changing market conditions and/or applicable laws, the content may no longer be reflective of current opinions or positions. Moreover, you should not assume that any discussion or information contained in this writing serves as the receipt of, or as a substitute for, personalized investment advice from JMG. To the extent that a reader has any questions regarding the applicability of any specific issue discussed above to his/her individual situation, he/she is encouraged to consult with the professional advisor of his/her choosing. JMG is neither a law firm, nor a certified public accounting firm, and no portion of the content provided in this writing should be construed as legal or accounting advice. A copy of JMG’s current written disclosure Brochure discussing our advisory services and fees is available upon request. If you are a JMG client, please remember to contact JMG, in writing, if there are any changes in your personal/financial situation or investment objectives for the purpose of reviewing/evaluating/revising our previous recommendations and/or services, or if you would like to impose, add, or to modify any reasonable restrictions to our investment advisory services. JMG shall continue to rely on the accuracy of information that you have provided.
To the extent provided in this writing, historical performance results for investment indices and/or categories have been provided for general comparison purposes only, and generally do not reflect the deduction of transaction and/or custodial charges, the deduction of an investment management fee, nor the impact of taxes, the incurrence of which would have the effect of decreasing historical performance results. It should not be assumed that your account holdings correspond directly to any comparative indices. Indices are not available for direct investment.
Market Segment (index representation) as follows: U.S. Large Cap (S&P Total Return); U.S. Mid-Cap (Russell Midcap Index Total Return); Foreign Developed (FTSE Developed Ex U.S. NR USD); Emerging Markets (FTSE Emerging NR USD); U.S. REITs (FTSE NAREIT Equity Total Return Index); Foreign REITs (FTSE EPRA/NAREIT Developed Real Estate Ex U.S. TR); U.S Bonds (Bloomberg US Aggregate Bond Index); U.S. TIPs (Bloomberg US Treasury Inflation-Linked Bond Index); Foreign Bond (USD Hedged) (Bloomberg Global Aggregate Ex US TR Hedged); Municipal Bonds (Bloomberg US Municipal Bond Index); High Yield Bonds (Bloomberg US Corporate High Yield Index).
