

How Can the Markets Be at All-Time Highs?
INVESTMENT COMMITTEE COMMENTARY April 2026
The U.S. stock market had strong positive performance in April. After a difficult March marked by the Iran war and deep-seated geopolitical anxiety, a wave of record-breaking highs came quickly as the S&P 500 crossed the 7,000 mark for the first time in its history. U.S. stocks enjoyed their strongest month since the post-pandemic era for the S&P 500 and the NASDAQ despite ongoing and uncertain strife in the Middle East and rising inflation. Small cap stocks also posted notable monthly gains.
April brought ceasefire negotiations and a temporary reopening of the Strait of Hormuz, which prompted oil prices to plummet before rising again. April’s rally was also fueled by a powerful start to corporate earnings season, particularly from large tech and AI companies. The AI data center boom continues to be strong. AI data center buildout and related capital spending is providing a tailwind to the U.S. economy and benefiting corporate earnings beyond the tech sector.
Nine of the eleven S&P market sectors ended April with gains, led by communication services, information technology, and consumer discretionary, each with double-digit gains. The only laggard for the month was energy, down 3.5%, but which remains the top performing sector of 2026 based on the steep price increases of crude oil.
Price pressures accelerated in April, largely attributable to escalating oil prices. The personal consumption expenditures price index (the preferred inflation indicator of the Federal Reserve) and the Consumer Price Index each showed 12-month inflation growth of over 3.0%, which is above the Federal Reserve’s 2.0% target. The re-acceleration of inflation in April followed tariff-driven goods inflation from earlier in the year.
Even with upward price pressures, consumer spending seems to be holding up. Companies across the consumer spectrum including banks, credit cards, casual dining, luxury goods, and travel are reporting resilient consumer spending. Consumer spending has helped drive strong earnings and higher stock prices.
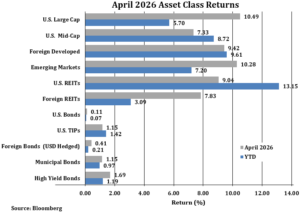
The S&P 500 rose 10.5% in April and is up 5.7% year to date through April 30. Foreign developed and emerging market equities also rose 9.4% and 10.3%, respectively, and are continuing strong returns to start 2026.
Bonds had modestly positive performance in April, despite a slight increase in 10-year Treasury yields (from 4.3% to 4.4%). Yields are reacting to elevated inflation coupled with strong growth metrics. The Bloomberg U.S. Aggregate Bond Index (AGG) gained 0.1% for the month. Other bond sub-indexes had more positive performance in April including high yield bonds, municipal bonds and U.S. Treasury Inflation Protected Securities (TIPS).
How Can the Markets Be at All-Time Highs?
There have been three distinct investment market periods in 2026.
- January / February (Risk On) – Strong economic data, elevated inflation and investor momentum.
- March (Risk Off) – Iran War with geopolitical uncertainty, steep oil price increases and high volatility. Reversal of market gains from January / February.
- April – (Risk On) – Falling event risk with (shaky) ceasefire in Iran War coupled with generally strong 1Q26 corporate earnings. Oversold equity positions from March reversed in April.
More recently, market participants looked through the war to fundamental and economic issues; namely corporate earnings, inflation / Fed policy, and consumer sentiment.
Corporate Earnings
News headlines have broadly attributed the strength of the stock market in 2026 to corporate earnings. But the reasons for all-time highs of the S&P 500 and Nasdaq are more nuanced. Different sectors, sub-sectors and stocks are contributing to resiliency in stock market prices relative to prior years.
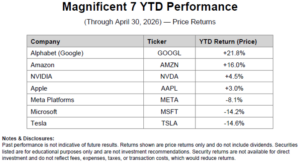
In recent years, the “Magnificent 7” stocks (AAPL, MSFT, AMZN, GOOGL, META, NVDA and TSLA) have materially carried S&P 500 performance. In 1Q26, GOOGL was a standout performer topping both earnings and revenue estimates while raising projections for both 2026 and 2027 capital expenditures (capex). However, solid earnings and revenue numbers, such as with META and MSFT, did not necessarily translate to stock performance as prices dropped based on lower margin outlooks amid heavy AI-spending plans.
The result is mixed year-to-date performance and wide dispersion between Mag 7 companies through April 30th.
Taking a deeper look into the tech sector’s market depth, notable earnings came from some important semiconductor companies. Within semiconductors, returns have been uneven year to date. Foundry and equipment leaders (TSM, ASML) have led, while AI bellwethers like NVIDIA have been more range bound following strong prior year gains (see chart below).
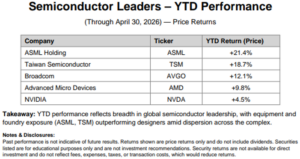
This is an example of a subsector that is benefiting from AI capex spending. While strong recent returns are welcome, investors will be looking for ongoing “beats and raises” in future quarterly earnings reports. At this point, good news is priced into semiconductor companies and recent reports have been good enough to hold tech sector gains earned in the prior years. In turn, the S&P 500 is benefiting from the breadth of the market as more companies report strong earnings.
Inflation / Fed Policy
The consumer price index (CPI) has risen from 2.7% to 3.3% between December and March. Similarly, the producer price index (PPI) has risen from 3.1% to 4.0% over the same period. Therefore, expectations of the Fed cutting rates (positive for stocks) are diminished. However, inflation metrics are not yet high enough to move stocks in a downward direction. Kevin Warsh, who is expected to be confirmed as the next Fed Chair shortly, will be challenged to manage monetary policy against the Fed’s dual mandate of maximum employment and stable prices.
Gasoline prices are going to be a significant impediment to the Fed. Gas prices, which fell 5.6% in February rose 18.9% in March and are continuing to rise as crude oil has soared to over $100 / bbl. Very likely, the next gasoline CPI reading will be over the 20% threshold. Currently, investors are viewing the spike in oil prices as transitory.
Consumer Sentiment
The shift in consumer sentiment can be seen in the University of Michigan Index of Consumer Sentiment. The Michigan Index fell from 56.4 in January to 47.6 in April. In early 2025, this index was above 70 and the trend has been lower, an indication of consumer uneasiness.
Business sentiment however, as measured by the National Federation of Independent Businesses – Optimism Index is less grim. This index, which focuses on small businesses, has declined from 99.5 in December to 95.8 in March. The level of deterioration seems to not be having a material impact on discretionary spending at this time.
Stocks have risen to all-time highs as consumer spending has held despite upward price pressures. For example, people continue to travel even as air and gas prices are increasing travel costs. Travel spending was up 5%, year over year, in March. More broadly, retail sales, ex-autos, rose 1.9% in March, the strongest monthly gain since early 2023.
Summary
April reinforced a critical point: markets can climb in the face of geopolitical stress when earnings, growth, and capital investment remain resilient. At this time, with the Iran War and oil supply uncertainties, energy remains the key swing factor for inflation and sentiment. However, investors have increasingly looked beyond near-term shocks. Our approach remains unchanged: stay diversified, avoid headline driven decisions, and let disciplined portfolio construction do its job in uncertain environments.
If you have any questions or wish to review your portfolio asset allocations, please consult your JMG Advisor.
Important Disclosure
Please remember that past performance may not be indicative of future results. Different types of investments involve varying degrees of risk, and there can be no assurance that the future performance of any specific investment, investment strategy, or product (including the investments and/or investment strategies recommended or undertaken by JMG Financial Group Ltd. (“JMG”), or any non-investment related content, made reference to directly or indirectly in this writing will be profitable, equal any corresponding indicated historical performance level(s), be suitable for your portfolio or individual situation, or prove successful.
This content is provided for educational purposes only. Due to various factors, including changing market conditions and/or applicable laws, the content may no longer be reflective of current opinions or positions. Moreover, you should not assume that any discussion or information contained in this writing serves as the receipt of, or as a substitute for, personalized investment advice from JMG. To the extent that a reader has any questions regarding the applicability of any specific issue discussed above to his/her individual situation, he/she is encouraged to consult with the professional advisor of his/her choosing. JMG is neither a law firm, nor a certified public accounting firm, and no portion of the content provided in this writing should be construed as legal or accounting advice.
A copy of JMG’s current written disclosure Brochure discussing our advisory services and fees is available upon request. If you are a JMG client, please remember to contact JMG, in writing, if there are any changes in your personal/financial situation or investment objectives for the purpose of reviewing/evaluating/revising our previous recommendations and/or services, or if you would like to impose, add, or to modify any reasonable restrictions to our investment advisory services. JMG shall continue to rely on the accuracy of information that you have provided.
To the extent provided in this writing, historical performance results for investment indices and/or categories have been provided for general comparison purposes only, and generally do not reflect the deduction of transaction and/or custodial charges, the deduction of an investment management fee, nor the impact of taxes, the incurrence of which would have the effect of decreasing historical performance results. It should not be assumed that your account holdings correspond directly to any comparative indices. Indices are not available for direct investment.
Market Segment (index representation) as follows: U.S. Large Cap (S&P Total Return); U.S. Mid-Cap (Russell Midcap Index Total Return); Foreign Developed (FTSE Developed Ex U.S. NR USD); Emerging Markets (FTSE Emerging NR USD); U.S. REITs (FTSE NAREIT Equity Total Return Index); Foreign REITs (FTSE EPRA/NAREIT Developed Real Estate Ex U.S. TR); U.S Bonds (Bloomberg US Aggregate Bond Index); U.S. TIPs (Bloomberg US Treasury Inflation-Linked Bond Index); Foreign Bond (USD Hedged) (Bloomberg Global Aggregate Ex US TR Hedged); Municipal Bonds (Bloomberg US Municipal Bond Index); High Yield Bonds (Bloomberg US Corporate High Yield Index).