

Government Debt and the Normalization of Interest Rates
INVESTMENT COMMITTEE COMMENTARY January 2024
Stocks had mixed performance in January. Repeating a theme from 2023, U.S. large cap growth and technology sector stocks had positive performance while the broader U.S. stock market had modest or negative total returns.
Entering 2024, stock valuations were elevated due to strong sentiment and high investor expectations. With that backdrop, the Federal Reserve (Fed) met in January and maintained the federal funds target rate range at its current 5.25%-5.50%. According to the Fed, the economy continued to show strength and job gains were steady. The Fed also noted inflation had slowed but remains above the Fed’s target of 2.0%, which bolstered the Fed’s reluctance to begin lowering interest rates. Investors were hoping for Fed rate cuts in March but the economic news lowered the probability that rate cuts would come that soon.
Recent inflation data has shown headline inflation continuing to trend lower. Though, prices in December inched higher as the headline consumer price index increased slightly with a reading of 3.4%. However, core prices, excluding the more volatile food and energy indexes, decelerated over the 12 months ended in December with a year-over-year increase of 3.9%.
The fourth-quarter earnings season for S&P 500 companies has been lackluster, so far. Roughly 25% of the S&P 500 companies have reported fourth-quarter earnings. Of these companies, 69% exceeded estimates, which is below the five-year average of 77%. In aggregate, companies reported earnings which are 5.3% below estimates.
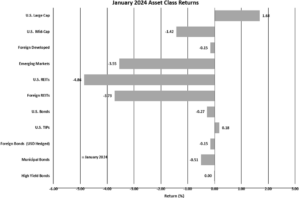
The S&P 500 rose 1.7% in January. Foreign developed equities had roughly flat performance, while emerging markets declined by 3.6%. After improved performance at the end of the year, U.S. and foreign REITs fell by 4.9% and 3.7%, respectively.
Bonds were generally down modestly in January as longer term interest rates inched higher. The yield on 10-year Treasuries rose from 3.88% to 3.99%. With this increase, the Bloomberg U.S. Aggregate Bond Index fell 0.3% during the month.
![]()
Government Debt and the Normalization of Interest Rates
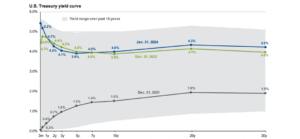
The Treasury bond yield curve remains inverted. This is a condition where short-term interest rates are higher than long-term rates. An inverted yield curve has historically been associated with an economic recession. The following chart shows current Treasury yields in the inverted state and the more normal configuration from December 2021.
![]()
Investors are now expecting a so called “soft landing” where economic growth slows without entering a recession. This was not the consensus view a year ago. If true the yield curve should normalize, but that may take a while.
For interest rates to normalize, short-term interest rates need to fall and/or long-term interest rates need to rise.
Short-term interest rates would decline if inflation continues to cool and the Fed begins cutting the Fed Funds rate as expected later this year. If there is a recession, the Fed will cut rates more rapidly. However, as noted above, employment has remained steady and the fourth quarter gross domestic product (GDP) accelerated at a rate of 3.3%. For 2023, GDP grew by 2.5% vs 1.9% in the prior year. The Fed may be less inclined to hurry rate cuts in this environment.
A bigger issue relates to long-term government debt. In 2024, a record $8.9 trillion of government debt will mature. Further, this year’s Federal deficit is forecast at $1.4 trillion. As a result, about $10 trillion of U.S. Treasuries will come to market this year. This is about one-third of the $34 trillion total federal debt. Public investors have continued to buy U.S. Treasuries, but will the demand continue? Foreign ownership percentages of Treasuries have been declining recently. U.S. investors have parked about $7 trillion in money market funds, but will those allocations shift to equities if interest rates begin falling? It will be interesting to see where the $10 trillion demand for newly issued Treasuries comes from and how that demand (or lack thereof) affects yields.
These conditions may lengthen the time it takes for the yield curve to normalize. JMG utilizes active managers for our fixed income allocations and we are confident in their collective ability to navigate the current environment.
If you have any questions, please consult your JMG Advisor.
Important Disclosure
Please remember that past performance may not be indicative of future results. Different types of investments involve varying degrees of risk, and there can be no assurance that the future performance of any specific investment, investment strategy, or product (including the investments and/or investment strategies recommended or undertaken by JMG Financial Group Ltd. (“JMG”), or any non-investment related content, made reference to directly or indirectly in this writing will be profitable, equal any corresponding indicated historical performance level(s), be suitable for your portfolio or individual situation, or prove successful. Due to various factors, including changing market conditions and/or applicable laws, the content may no longer be reflective of current opinions or positions. Moreover, you should not assume that any discussion or information contained in this writing serves as the receipt of, or as a substitute for, personalized investment advice from JMG. To the extent that a reader has any questions regarding the applicability of any specific issue discussed above to his/her individual situation, he/she is encouraged to consult with the professional advisor of his/her choosing. JMG is neither a law firm, nor a certified public accounting firm, and no portion of the content provided in this writing should be construed as legal or accounting advice. A copy of JMG’s current written disclosure Brochure discussing our advisory services and fees is available upon request. If you are a JMG client, please remember to contact JMG, in writing, if there are any changes in your personal/financial situation or investment objectives for the purpose of reviewing/evaluating/revising our previous recommendations and/or services, or if you would like to impose, add, or to modify any reasonable restrictions to our investment advisory services. JMG shall continue to rely on the accuracy of information that you have provided.
To the extent provided in this writing, historical performance results for investment indices and/or categories have been provided for general comparison purposes only, and generally do not reflect the deduction of transaction and/or custodial charges, the deduction of an investment management fee, nor the impact of taxes, the incurrence of which would have the effect of decreasing historical performance results. It should not be assumed that your account holdings correspond directly to any comparative indices. Indices are not available for direct investment.
Market Segment (index representation) as follows: U.S. Large Cap (S&P Total Return); U.S. Mid-Cap (Russell Midcap Index Total Return); Foreign Developed (FTSE Developed Ex U.S. NR USD); Emerging Markets (FTSE Emerging NR USD); U.S. REITs (FTSE NAREIT Equity Total Return Index); Foreign REITs (FTSE EPRA/NAREIT Developed Real Estate Ex U.S. TR); U.S Bonds (Bloomberg US Aggregate Bond Index); U.S. TIPs (Bloomberg US Treasury Inflation-Linked Bond Index); Foreign Bond (USD Hedged) (Bloomberg Global Aggregate Ex US TR Hedged); Municipal Bonds (Bloomberg US Municipal Bond Index); High Yield Bonds (Bloomberg US Corporate High Yield Index).