

Fixed Income Update
INVESTMENT COMMITTEE COMMENTARY May 2025
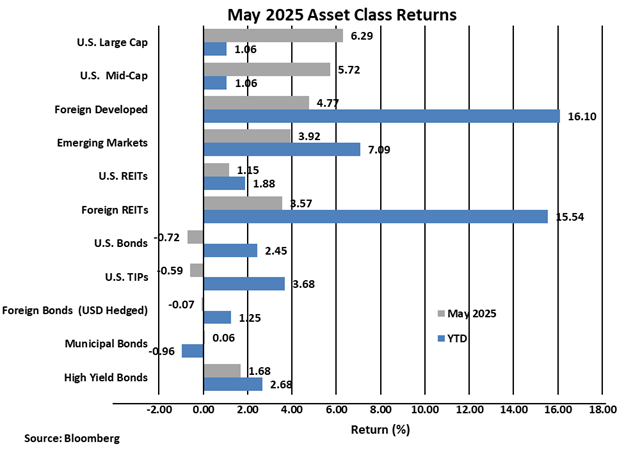
May proved to be a strong month for U.S. stocks as the S&P 500 had its best month since 2023, up 6.3%, rebounding from market lows in April in response to U.S. trade policy. Strong corporate earnings data and a solid jobs report supported equities. The month brought some progress in the U.S.-China trade war, with an agreement for a 90-day reduction in tariffs while talks aimed at a trade resolution continue. Separately, Middle East investment deals helped push technology sector shares higher.
Foreign developed and emerging market equities also performed well in May. U.S. investor performance in foreign equities is also benefitting from a falling U.S. dollar (currently down 10% in 2025). The trade-war uncertainty is continuing to influence a “sell-America” trade that is weighing on the dollar as international investors liquidate U.S. based assets. Until there is clarity on trade deals, the dollar will be susceptible to further downside pressure. Global economic activity as measured by the Global Composite Purchasing Managers’ Index (manufacturing and services combined) is generally weakening. However, caution must be exercised in interpreting economic data as it may be months before reliable economic statistics are available to accurately assess the effects of the Trump tariff policies.
Bond ratings agency Moody’s downgraded U.S. sovereign debt to Aa1 from Aaa. Moody’s stated the downgrade came for two reasons: first, a lack of progress from numerous past Congresses and administrations to address rising fiscal deficits, and second, growing interest costs as a percentage of GDP. Of note, other bond ratings agencies (Standard & Poors and Fitch) downgraded U.S. debt years ago and there was no immediate event to cause the recent Moody’s downgrade. The yield on 10-year Treasury bonds rose in May from 4.17% to 4.41%. For May, the Bloomberg U.S. Aggregate Bond Index fell by 0.7% although performance in 2025 remains positive at 2.5%.
Fixed Income Update
The Federal Reserve Open Market Committee (Fed) met in May and made no changes in the fed funds rate. The Fed mostly met market expectations with its decision. However, investors are still expecting multiple rate cuts in 2025. Fed Chair Jerome Powell reiterated the Fed is in “wait-and-see” mode as they assess incoming economic data and the impact of tariffs on both economic growth and inflation. So far, growth and inflation are holding at levels sufficient for the Fed to maintain its policy stance. That will leave shorter-duration yields elevated in the near-term, but growing uncertainty about tariffs and the trade war’s impact on the economy is showing up as increased volatility across the yield curve.
Most market observers expect that tariffs and policy uncertainty will slow growth; it’s just a question of how much growth slows. The pace of slowing will determine whether a soft landing and likely a stable market or a recession (or at least a stall in growth) occurs. The chart below shows how the U.S. Treasury yield curve has moved over time. There is upside pressure at longer durations on expectations of high deficits, elevated inflation, and lower foreign exposure to U.S. government debt.
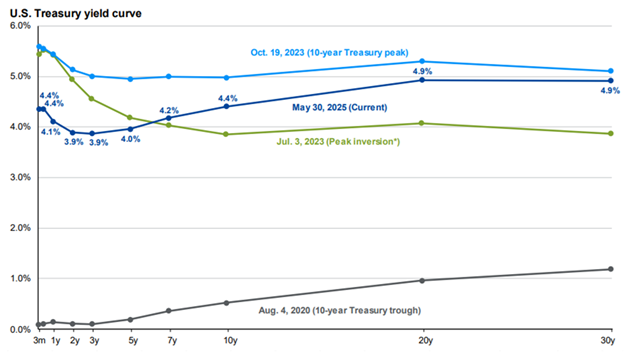
Source: FactSet, Federal Reserve, J.P. Morgan Asset Management. Analysis references data back to 2020. *Peak inversion is measured by the spread between the yield on a 10-year Treasury and 2-year Treasury. Guide to the Markets – U.S. Data are as of May 30, 2025.
Municipal Bonds
Municipal bond performance in 2025 has trailed taxable bonds of similar quality. This has been driven by technical factors rather than fundamentals. Municipal bonds have been impacted by supply imbalances, tax season municipal bond “sell-offs”, some illiquidity, volatility and uncertainties regarding whether municipal bonds will remain tax-exempt for federal income tax purposes. We do not believe the municipal bond underperformance is permanent. As a result of the sell-off, municipal bonds have attractive tax-equivalent yields relative to taxable bonds. For investors who are in higher marginal income tax brackets, municipal bonds should provide attractive returns going forward. The following chart shows current municipal-bond yield curves.
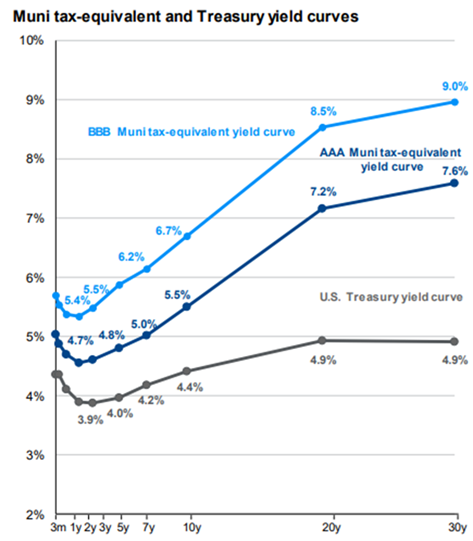
Source: J.P. Morgan Asset Management; Bloomberg, FactSet, Federal Reserve, S&P Global. Municipal tax-equivalent yields are calculated based on municipal bond curves for each credit rating according to S&P Global and assume a top-income tax bracket of 37% plus a Medicare tax rate of 3.8% for a total; tax rate pf 40.8%. Guide to the Markets – U.S. Data are as of May 30, 2025
In summary, May experienced a relief rally in US equities, as the shock of the Trump tariffs subsided and negotiations began. Some initial effects of the trade war became apparent as long-term rates rose, while the dollar continued to fall. Despite the turbulence in the markets, fundamentals continued to be supportive, at least near-term. While the Trump administration’s reworking of international trade still has a lot of uncertainty, the pace of change has slowed, and markets are hopeful for a resolution which will still allow trade to continue. We continue to watch carefully for opportunities and are maintaining our diversified stance in the face of potential continued volatility.
If you have any questions, please consult your JMG Advisor.
Important Disclosure
Please remember that past performance may not be indicative of future results. Different types of investments involve varying degrees of risk, and there can be no assurance that the future performance of any specific investment, investment strategy, or product (including the investments and/or investment strategies recommended or undertaken by JMG Financial Group Ltd. (“JMG”), or any non-investment related content, made reference to directly or indirectly in this writing will be profitable, equal any corresponding indicated historical performance level(s), be suitable for your portfolio or individual situation, or prove successful. Due to various factors, including changing market conditions and/or applicable laws, the content may no longer be reflective of current opinions or positions. Moreover, you should not assume that any discussion or information contained in this writing serves as the receipt of, or as a substitute for, personalized investment advice from JMG. To the extent that a reader has any questions regarding the applicability of any specific issue discussed above to his/her individual situation, he/she is encouraged to consult with the professional advisor of his/her choosing. JMG is neither a law firm, nor a certified public accounting firm, and no portion of the content provided in this writing should be construed as legal or accounting advice. A copy of JMG’s current written disclosure Brochure discussing our advisory services and fees is available upon request. If you are a JMG client, please remember to contact JMG, in writing, if there are any changes in your personal/financial situation or investment objectives for the purpose of reviewing/evaluating/revising our previous recommendations and/or services, or if you would like to impose, add, or to modify any reasonable restrictions to our investment advisory services. JMG shall continue to rely on the accuracy of information that you have provided.
To the extent provided in this writing, historical performance results for investment indices and/or categories have been provided for general comparison purposes only, and generally do not reflect the deduction of transaction and/or custodial charges, the deduction of an investment management fee, nor the impact of taxes, the incurrence of which would have the effect of decreasing historical performance results. It should not be assumed that your account holdings correspond directly to any comparative indices. Indices are not available for direct investment.
Market Segment (index representation) as follows: U.S. Large Cap (S&P Total Return); U.S. Mid-Cap (Russell Midcap Index Total Return); Foreign Developed (FTSE Developed Ex U.S. NR USD); Emerging Markets (FTSE Emerging NR USD); U.S. REITs (FTSE NAREIT Equity Total Return Index); Foreign REITs (FTSE EPRA/NAREIT Developed Real Estate Ex U.S. TR); U.S Bonds (Bloomberg US Aggregate Bond Index); U.S. TIPs (Bloomberg US Treasury Inflation-Linked Bond Index); Foreign Bond (USD Hedged) (Bloomberg Global Aggregate Ex US TR Hedged); Municipal Bonds (Bloomberg US Municipal Bond Index); High Yield Bonds (Bloomberg US Corporate High Yield Index).