

Fitch Downgrade and the Recent Rally in Equity Markets
INVESTMENT COMMITTEE COMMENTARY July 2023
Stocks closed higher in July as the U.S. economy and the stock market have stayed surprisingly resilient despite rising interest rates.
During the month, the Federal Reserve (Fed) hiked interest rates another 25 basis points to the highest level in 22 years. However, there are signs inflation is finally receding. The Consumer Price Index and the Personal Consumption Expenditures Price Index saw their respective 12-month rates fall to the lowest levels in nearly two years. Import and export prices dipped lower in July, as did producer prices. Consumer spending, a bellwether of economic growth, continued to increase, although not quite at the pace set earlier in the year. The same can be said for gross domestic product, which accelerated in the second quarter and has continued to advance since the second quarter of 2022.
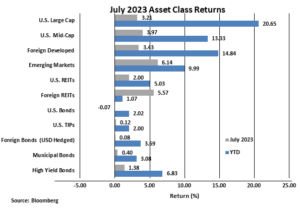
The S&P 500 gained 3.2%, the fifth straight month of gains. Year-to date, the total return of the S&P 500 of 20.6% is the best seven month start for a year since 1997. All U.S. equity sectors advanced in July and expanding market breadth was led by the energy and communication services sectors. Foreign developed and emerging markets equities gained 3.4% and 6.1%, respectively. U.S. equity valuations have increased with the current S&P 500 forward price/earnings (P/E) ratio at 19.57 times earnings, which is above the 25-year average P/E of 16.78 times earnings.
Rising bond yields are a performance headwind for investment grade bonds. The yield on 10-year Treasuries rose from 3.81% to 3.95%. As a result, the Bloomberg U.S. Aggregate Bond Index return fell slightly by 0.1%. Municipal and high yield bonds again had positive monthly returns of 0.4% and 1.4%, respectively.
Fitch Downgrade and the Recent Rally in Equity Markets
Fitch Ratings, a bond and credit ratings provider, recently lowered its rating on U.S. Treasury debt from AAA to AA+. The downgrade was made because of “a high and growing general government debt burden, and the erosion of governance … over the last two decades that has manifested in repeated debt limit standoffs and last-minute resolutions.” It is important to note that S&P Global Ratings, another of the big three rating agencies, already downgraded Treasury debt to their second highest level almost exactly 12 years ago.
The markets took the downgrade in stride. The unsustainable spending and size of the U.S. debt and deficit are a longer-term issue and already known. Total U.S. debt now stands at $32.6 trillion which is already $1.2 trillion higher than the level on June 2nd when Congress voted to suspend the debt ceiling for another two years. The deficit for the first nine months of fiscal year 2023 is $1.4 trillion, already higher than the full-year fiscal deficit of 2022. Fitch was correct in drawing attention to total U.S. debt and the lack of attention by the U.S. government to responsibly manage fiscal spending. Possible government actions to raise taxes or reduce spending are insufficient to fully resolve the massive debt problem. The solution must also come from very healthy and extended U.S. economic growth. Yet, higher interest rates are impeding both U.S. and global economic growth and U.S. government spending is at about 25% of gross domestic product (GDP). U.S. debt is a very important long-term issue, but the Fitch downgrade is not the major determinant of recent stock and bond prices.
The recent equity rally has been driven by better than expected corporate earnings and by strong investor sentiment as under-exposed equity investors are now chasing stocks. Negative stock sentiment in early 2023 has now become positive. There are four main reasons for the improved sentiment:
- More investors have better expectations for corporate earnings and fundamentals.
- More investors now believe the U.S. economy will experience a “soft or no” landing scenario with regards to a recession.
- More investors believe disinflation (falling inflation) will continue.
- More investors believe the Fed is almost done with interest rate hikes.
As a result, the current level of the S&P 500 is priced for near perfection where all four of the above views must continue to hold if the S&P 500 is going to sustain and not fall back. Because valuations are rich from the recent rally, they may be a headwind for sharply higher S&P 500 returns over the next market cycle. Alternatively, even modestly negative news could cause some market pullback.
To be clear, while valuations are high, we are not advocating going underweight stocks or raising excess cash. Trending markets can continue for extended periods of time even when prices seem disconnected from fundamental factors. While the top 10 stocks of the S&P 500 are priced at higher levels, not all stocks are at high valuations. For example, U.S. small cap value stocks and foreign developed country stocks are selling at more favorable multiples. Regarding fixed income markets, “higher for longer” remains the theme. Some investors are now shifting portions of cash and short duration bonds to intermediate duration bonds where yields are rising toward cycle highs.
We always favor a disciplined investing approach during periods of market uncertainty and consciously avoiding market timing amidst the news of the day. The process: stay diversified and rebalance back to defined target asset allocations, including defined cash reserves, while being cautious of extreme market valuations in specific market sectors. Further, manage investment gains and losses in planning for income tax, retirement, charitable and estate strategies.
If you have any questions, please consult your JMG Advisor.
Important Disclosure
Please remember that past performance may not be indicative of future results. Different types of investments involve varying degrees of risk, and there can be no assurance that the future performance of any specific investment, investment strategy, or product (including the investments and/or investment strategies recommended or undertaken by JMG Financial Group Ltd. (“JMG”), or any non-investment related content, made reference to directly or indirectly in this writing will be profitable, equal any corresponding indicated historical performance level(s), be suitable for your portfolio or individual situation, or prove successful. Due to various factors, including changing market conditions and/or applicable laws, the content may no longer be reflective of current opinions or positions. Moreover, you should not assume that any discussion or information contained in this writing serves as the receipt of, or as a substitute for, personalized investment advice from JMG. To the extent that a reader has any questions regarding the applicability of any specific issue discussed above to his/her individual situation, he/she is encouraged to consult with the professional advisor of his/her choosing. JMG is neither a law firm, nor a certified public accounting firm, and no portion of the content provided in this writing should be construed as legal or accounting advice. A copy of JMG’s current written disclosure Brochure discussing our advisory services and fees is available upon request. If you are a JMG client, please remember to contact JMG, in writing, if there are any changes in your personal/financial situation or investment objectives for the purpose of reviewing/evaluating/revising our previous recommendations and/or services, or if you would like to impose, add, or to modify any reasonable restrictions to our investment advisory services. JMG shall continue to rely on the accuracy of information that you have provided.
To the extent provided in this writing, historical performance results for investment indices and/or categories have been provided for general comparison purposes only, and generally do not reflect the deduction of transaction and/or custodial charges, the deduction of an investment management fee, nor the impact of taxes, the incurrence of which would have the effect of decreasing historical performance results. It should not be assumed that your account holdings correspond directly to any comparative indices. Indices are not available for direct investment.
Market Segment (index representation) as follows: U.S. Large Cap (S&P Total Return); U.S. Mid-Cap (Russell Midcap Index Total Return); Foreign Developed (FTSE Developed Ex U.S. NR USD); Emerging Markets (FTSE Emerging NR USD); U.S. REITs (FTSE NAREIT Equity Total Return Index); Foreign REITs (FTSE EPRA/NAREIT Developed Real Estate Ex U.S. TR); U.S Bonds (Bloomberg US Aggregate Bond Index); U.S. TIPs (Bloomberg US Treasury Inflation-Linked Bond Index); Foreign Bond (USD Hedged) (Bloomberg Global Aggregate Ex US TR Hedged); Municipal Bonds (Bloomberg US Municipal Bond Index); High Yield Bonds (Bloomberg US Corporate High Yield Index).