
Monthly Economic News
Monthly Economic News
Emerging Markets and Chinese Regulation
INVESTMENT COMMITTEE COMMENTARY JULY 2021
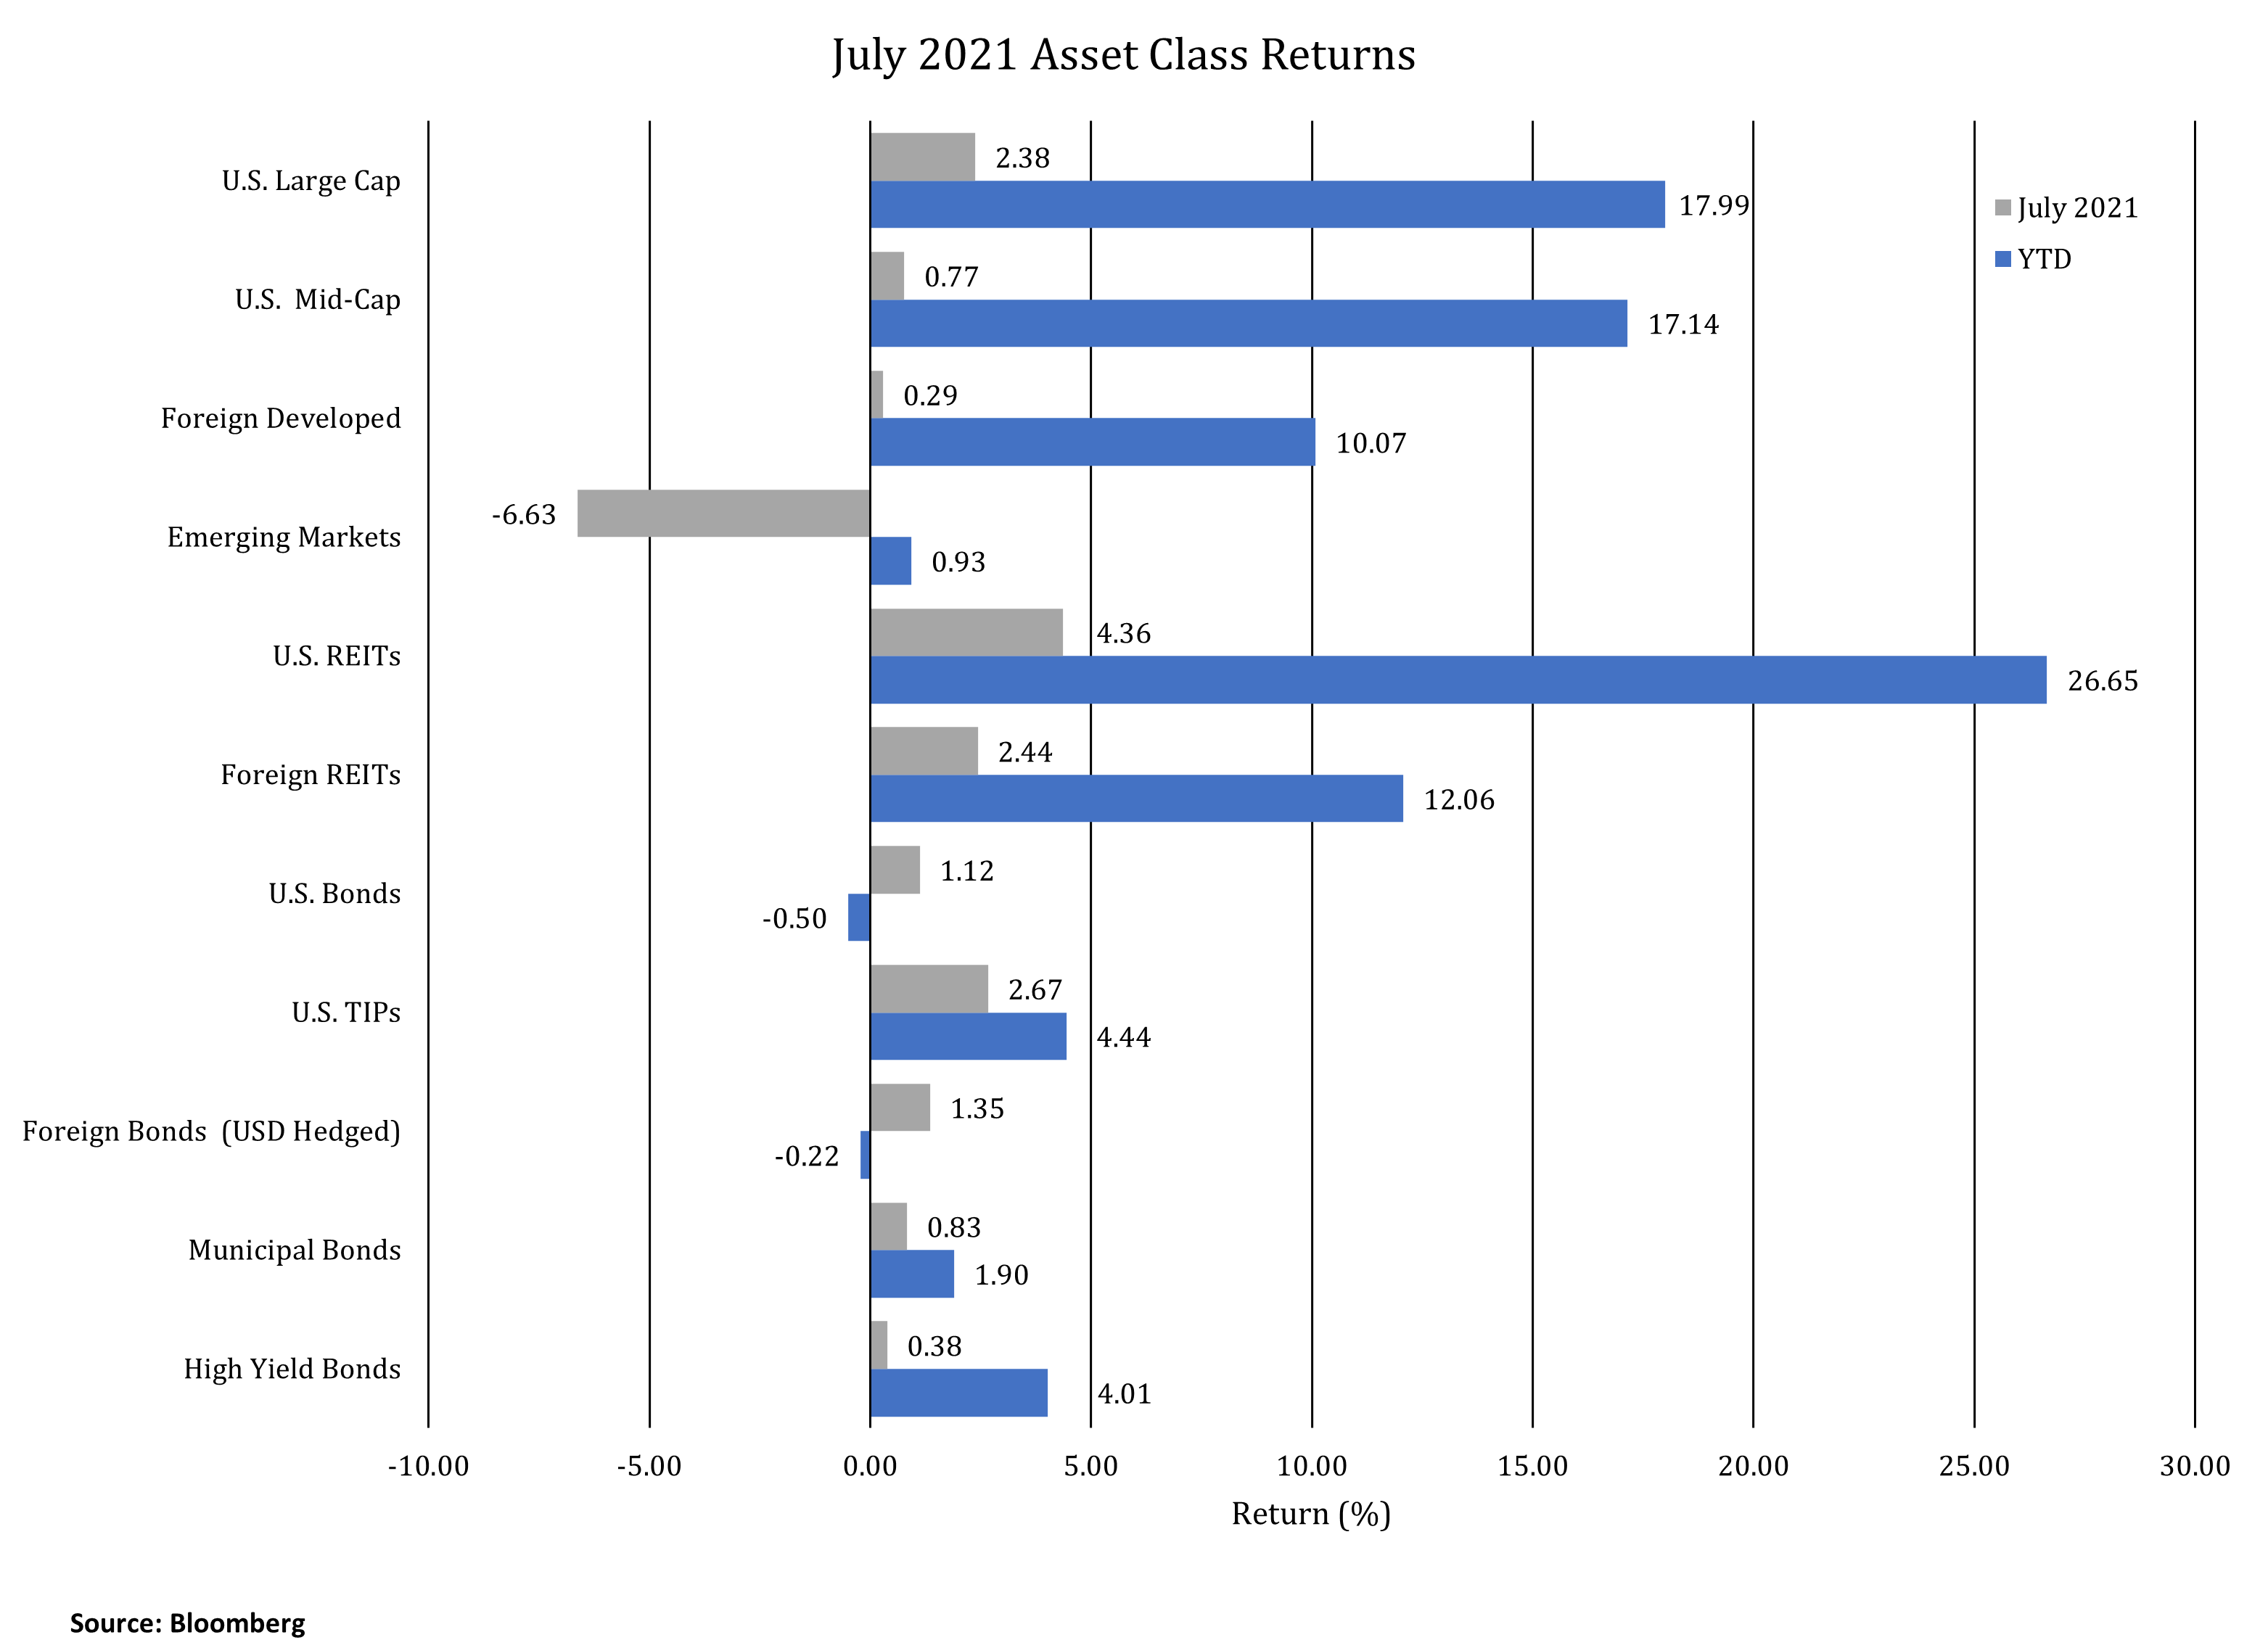
Asset class performance in July was generally positive. An exception to this trend was emerging markets, largely driven by volatility in Chinese equities.
Overcoming a mid-July dip, the S&P 500 rose 2.4% as corporate earnings largely met or exceeded expectations. Notably, real estate also had strong July performance with residential, industrial and self-storage real estate sectors leading the gains.
The yield on 10-year U.S. Treasuries fell for the fourth straight month, declining from 1.45% to 1.24%. As a result, bonds had solid performance in July. Early 2021 fixed income losses are mostly recovered although longer-duration bonds still have negative year-to-date returns.
The Bureau of Economic Analysis (BEA) released its first estimate of real gross domestic product (GDP) for the second quarter. GDP grew at a robust seasonally adjusted annualized rate of 6.5%. The level and composition of economic growth was consistent with the first quarter. Personal consumption expenditures made a significant contribution to GDP. Consumer services contributed 5.1% of the 6.5% GDP growth with 2.2% of the 5.1% coming from food services and accommodations. The strong GDP numbers of 2021 are likely attributable to the reopening of the economy.
Regarding inflation, headline CPI was 5.3% for June. Not all prices are exhibiting inflation, but hot spots include gasoline, used vehicles, airline fares and food away from home (restaurants). Inflation bears watching, but the arithmetic of CPI is still impacted by year-over-year changes based on mid-2020 COVID prices. In a few quarters, the data should provide a better picture of the degree of non-transitory inflation.
Emerging Markets and Chinese Regulation
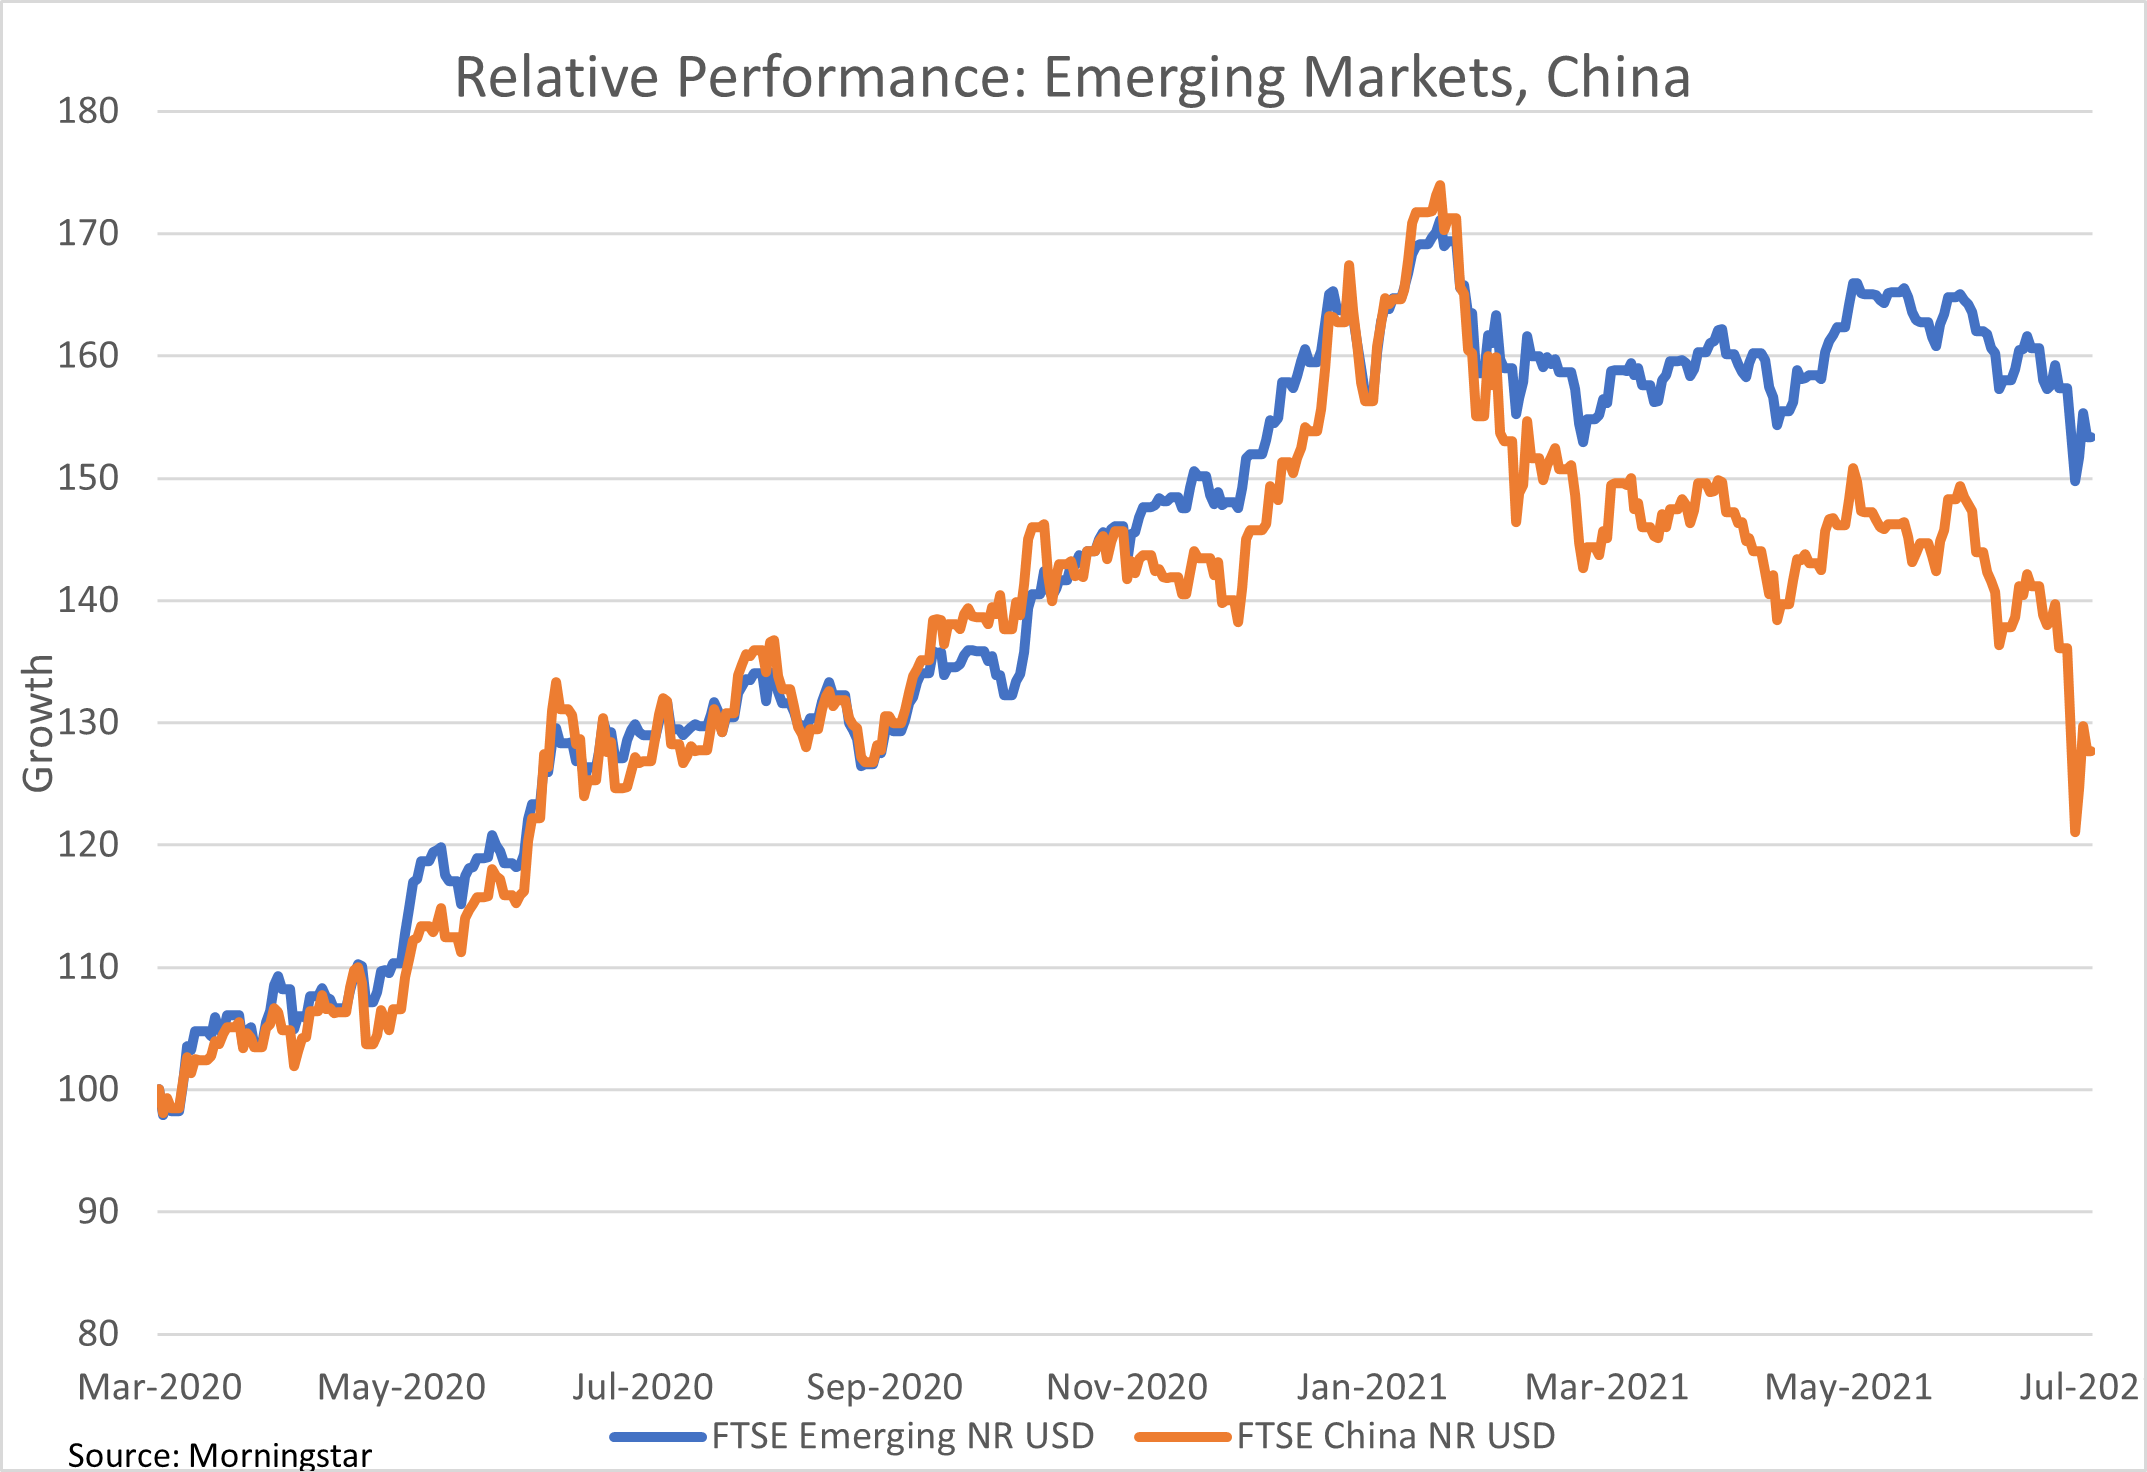
In July, emerging market equities fell by 6.6%, giving up gains made earlier in the year. Besides a resurgence of COVID cases in several emerging market countries, a good portion of the emerging markets decline was due to China, which represents about 40% of the emerging markets index. The FTSE China Index fell over 13% in July, partially on concerns of Chinese regulation.
Throughout the year, China has implemented regulations to manage an array of business and social issues. Chinese companies listed on foreign exchanges now face new regulations. Internet e-commerce giant, Alibaba, was probed by regulators in April. More recently, the Chinese government has asserted greater control over select industries including private tutoring education, technology, health care and real estate.
In response, volatility has increased and stock prices have fallen to a greater degree than other emerging market countries. The following chart shows the divergence of China stock performance in 2021 compared to the broader emerging markets.
JMG continues to believe emerging markets equities should be included in broadly diversified portfolios.
- Emerging market countries offer growth through consumer demand and favorable demographics. Approximately 90% of the world’s population under age 30 lives in emerging market countries. In addition, more than half of global economic growth is driven by emerging markets.
- There are over twenty-five emerging markets countries. China is just an important subset of the broader emerging markets asset class.
- Emerging markets often have lower valuations (price/earnings ratios) than the U.S. or other developed countries. Growth sectors in emerging markets may provide for higher returns than the equivalent U.S. sectors.
- China will likely balance its regulatory restrictions with more moderate monetary and fiscal policies if economic growth is slowing.
- Emerging markets countries are still experiencing significant COVID effects and lockdowns, particularly in Southeast Asia. As vaccines are more widely distributed and countries reopen, supply chains with the U.S. will be reestablished to the benefit of all trading partners.
We continue to closely monitor our client portfolios. If you have any questions, you should consult with your JMG Advisor.
Important Disclosure
Please remember that past performance may not be indicative of future results. Different types of investments involve varying degrees of risk, and there can be no assurance that the future performance of any specific investment, investment strategy, or product made reference to directly or indirectly in this writing, will be profitable, equal any corresponding indicated historical performance level(s), or be suitable for your portfolio. Due to various factors, including changing market conditions, the content may no longer be reflective of current opinions or positions. Moreover, you should not assume that any discussion or information contained in this writing serves as the receipt of, or as a substitute for, personalized investment advice from JMG Financial Group, Ltd. To the extent that a reader has any questions regarding the applicability of any specific issue discussed above to his/her individual situation, he/she is encouraged to consult with the professional advisor of his/her choosing. JMG is neither a law firm nor a certified public accounting firm and no portion of the content provided in this writing should be construed as legal or accounting advice. A copy of JMG’s current written disclosure statement discussing advisory services and fees is available for review upon request.
To the extent provided in this writing, historical performance results for investment indices and/or categories have been provided for general comparison purposes only, and generally do not reflect the deduction of transaction and/or custodial charges, the deduction of an investment management fee, nor the impact of taxes, the incurrence of which would have the effect of decreasing historical performance results. It should not be assumed that your account holdings correspond directly to any comparative indices. Indices are not available for direct investment. Market Segment (index representation) as follows: U.S. Large Cap (S&P 500 Total Return); U.S. Mid-Cap (Russell Midcap Index Total Return); Foreign Developed (FTSE Developed Ex U.S. NR USD); Emerging Markets (FTSE Emerging NR USD); U.S. REITs (FTSE NAREIT Equity Total Return Index); Foreign REITs (FTSE EPRA/NAREIT Developed Real Estate Ex U.S. TR); U.S. Bonds (Bloomberg Barclays Capital U.S. Aggregate Index); U.S. TIPs (Bloomberg Barclays Capital U.S. Treasury: U.S. TIPs); Foreign Bonds (USD Hedged) (Bloomberg Barclays Capital Global Aggregate Ex U.S. TR Hedged); Municipal Bonds (Bloomberg Barclays Capital Municipal Bond Index); High Yield Bonds (Bloomberg Barclays Capital High Yield Index).