

Earnings Growth Is Broadening Outside the Magnificent Seven
INVESTMENT COMMITTEE COMMENTARY March 2024
In March, the equity rally continued, aided by familiar factors such as solid economic growth, generally as-expected inflation data, AI enthusiasm and bullish Federal Reserve (Fed) guidance. Broadly speaking, economic and inflation data, while slowing, met investor expectations of stable growth and easing inflation. In mid-March, updated Fed interest rate projections still pointed towards three rate cuts in 2024, further reinforcing investor expectations for a June rate cut. Those positive factors combined with additional strong AI-related earnings reports (this time from Micron) continued to push markets broadly higher as the S&P 500 crossed 5,200 for the first time and ended March with strong gains.
Despite fears of a recession last year, the US economy remains resilient with year over year gross domestic product (GDP) growth of 3.1% for the fourth quarter. Consumer spending also expanded in March with the most recent reading up 0.8%. However, headline inflation (CPI) has roughly flatlined at around 3.2%. Further, core CPI, which excludes food and energy, is even higher at 3.8%. The key point is that neither of these CPI measures is expected to quickly move to the Fed’s 2.0% inflation target. A major component in core CPI is shelter (owner’s equivalent rent and cash rent) where levels remain higher at about 6%. Headline CPI does not appear to be moving back to pre-pandemic levels. Bottom line: based on current inflation data, interest rate cuts by the Fed could occur later in the year than originally expected. Right now, the stock market is overlooking the inflation uncertainties and still expecting an economic soft landing.
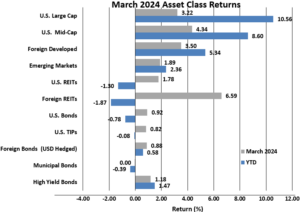
The S&P 500 rose 3.2% in March. Foreign developed and emerging markets equities also had gains of 3.5% and 1.9%, respectively. U.S. REITs were up 1.8% and foreign REITs recovered a portion of early year losses, gaining 6.6% for the month.
Bond prices rose in March as the yield on 10-year Treasuries fell slightly from 4.25% to 4.20%. The Bloomberg U.S. Aggregate Bond Index was up 0.9% during the month. Other bond sub-indexes including TIPS, foreign bonds (hedged) and high yield bonds had positive performance in March, but year-to-date performance is mixed as interest rates for the year have trended higher.
![]()
Earnings Growth Is Broadening Outside the Magnificent Seven
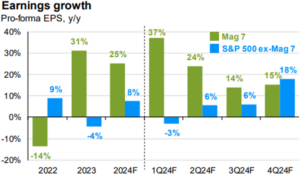
Large cap growth (Magnificent 7) stocks continued to dominate S&P 500 performance. Encouragingly, the first quarter of 2024 reflected a much more evenly distributed rally compared to the fourth quarter of 2023, where tech and tech-aligned sectors handily outperformed the rest of the market. Over the past three months, markets saw broad gains distributed more equitably amongst various sectors and industries.
Forward earnings growth consensus expectations for the broader S&P 500 constituent companies are improving as outlined below.
![]()
While the rally in stocks did broaden out, there was less benefit to small cap stocks as they were some of the notable laggards over the past three months. Small caps registered a positive return for the first quarter but lagged large caps as concerns about stubbornly high interest rates weighed on small caps because of their sensitivity to higher borrowing costs. However, small caps now have lower and more favorable market valuations favoring new investment, which should help performance in a soft-landing scenario.
From an investment style standpoint, growth once again outperformed value in the first quarter but the margin was much narrower than last year, as both investment styles logged strong returns for the first quarter.
If you have any questions, please consult your JMG Advisor.
Important Disclosure
Please remember that past performance may not be indicative of future results. Different types of investments involve varying degrees of risk, and there can be no assurance that the future performance of any specific investment, investment strategy, or product (including the investments and/or investment strategies recommended or undertaken by JMG Financial Group Ltd. (“JMG”), or any non-investment related content, made reference to directly or indirectly in this writing will be profitable, equal any corresponding indicated historical performance level(s), be suitable for your portfolio or individual situation, or prove successful. Due to various factors, including changing market conditions and/or applicable laws, the content may no longer be reflective of current opinions or positions. Moreover, you should not assume that any discussion or information contained in this writing serves as the receipt of, or as a substitute for, personalized investment advice from JMG. To the extent that a reader has any questions regarding the applicability of any specific issue discussed above to his/her individual situation, he/she is encouraged to consult with the professional advisor of his/her choosing. JMG is neither a law firm, nor a certified public accounting firm, and no portion of the content provided in this writing should be construed as legal or accounting advice. A copy of JMG’s current written disclosure Brochure discussing our advisory services and fees is available upon request. If you are a JMG client, please remember to contact JMG, in writing, if there are any changes in your personal/financial situation or investment objectives for the purpose of reviewing/evaluating/revising our previous recommendations and/or services, or if you would like to impose, add, or to modify any reasonable restrictions to our investment advisory services. JMG shall continue to rely on the accuracy of information that you have provided.
To the extent provided in this writing, historical performance results for investment indices and/or categories have been provided for general comparison purposes only, and generally do not reflect the deduction of transaction and/or custodial charges, the deduction of an investment management fee, nor the impact of taxes, the incurrence of which would have the effect of decreasing historical performance results. It should not be assumed that your account holdings correspond directly to any comparative indices. Indices are not available for direct investment.
Market Segment (index representation) as follows: U.S. Large Cap (S&P Total Return); U.S. Mid-Cap (Russell Midcap Index Total Return); Foreign Developed (FTSE Developed Ex U.S. NR USD); Emerging Markets (FTSE Emerging NR USD); U.S. REITs (FTSE NAREIT Equity Total Return Index); Foreign REITs (FTSE EPRA/NAREIT Developed Real Estate Ex U.S. TR); U.S Bonds (Bloomberg US Aggregate Bond Index); U.S. TIPs (Bloomberg US Treasury Inflation-Linked Bond Index); Foreign Bond (USD Hedged) (Bloomberg Global Aggregate Ex US TR Hedged); Municipal Bonds (Bloomberg US Municipal Bond Index); High Yield Bonds (Bloomberg US Corporate High Yield Index).