

2021 Year in Review
INVESTMENT COMMITTEE COMMENTARY December 2021
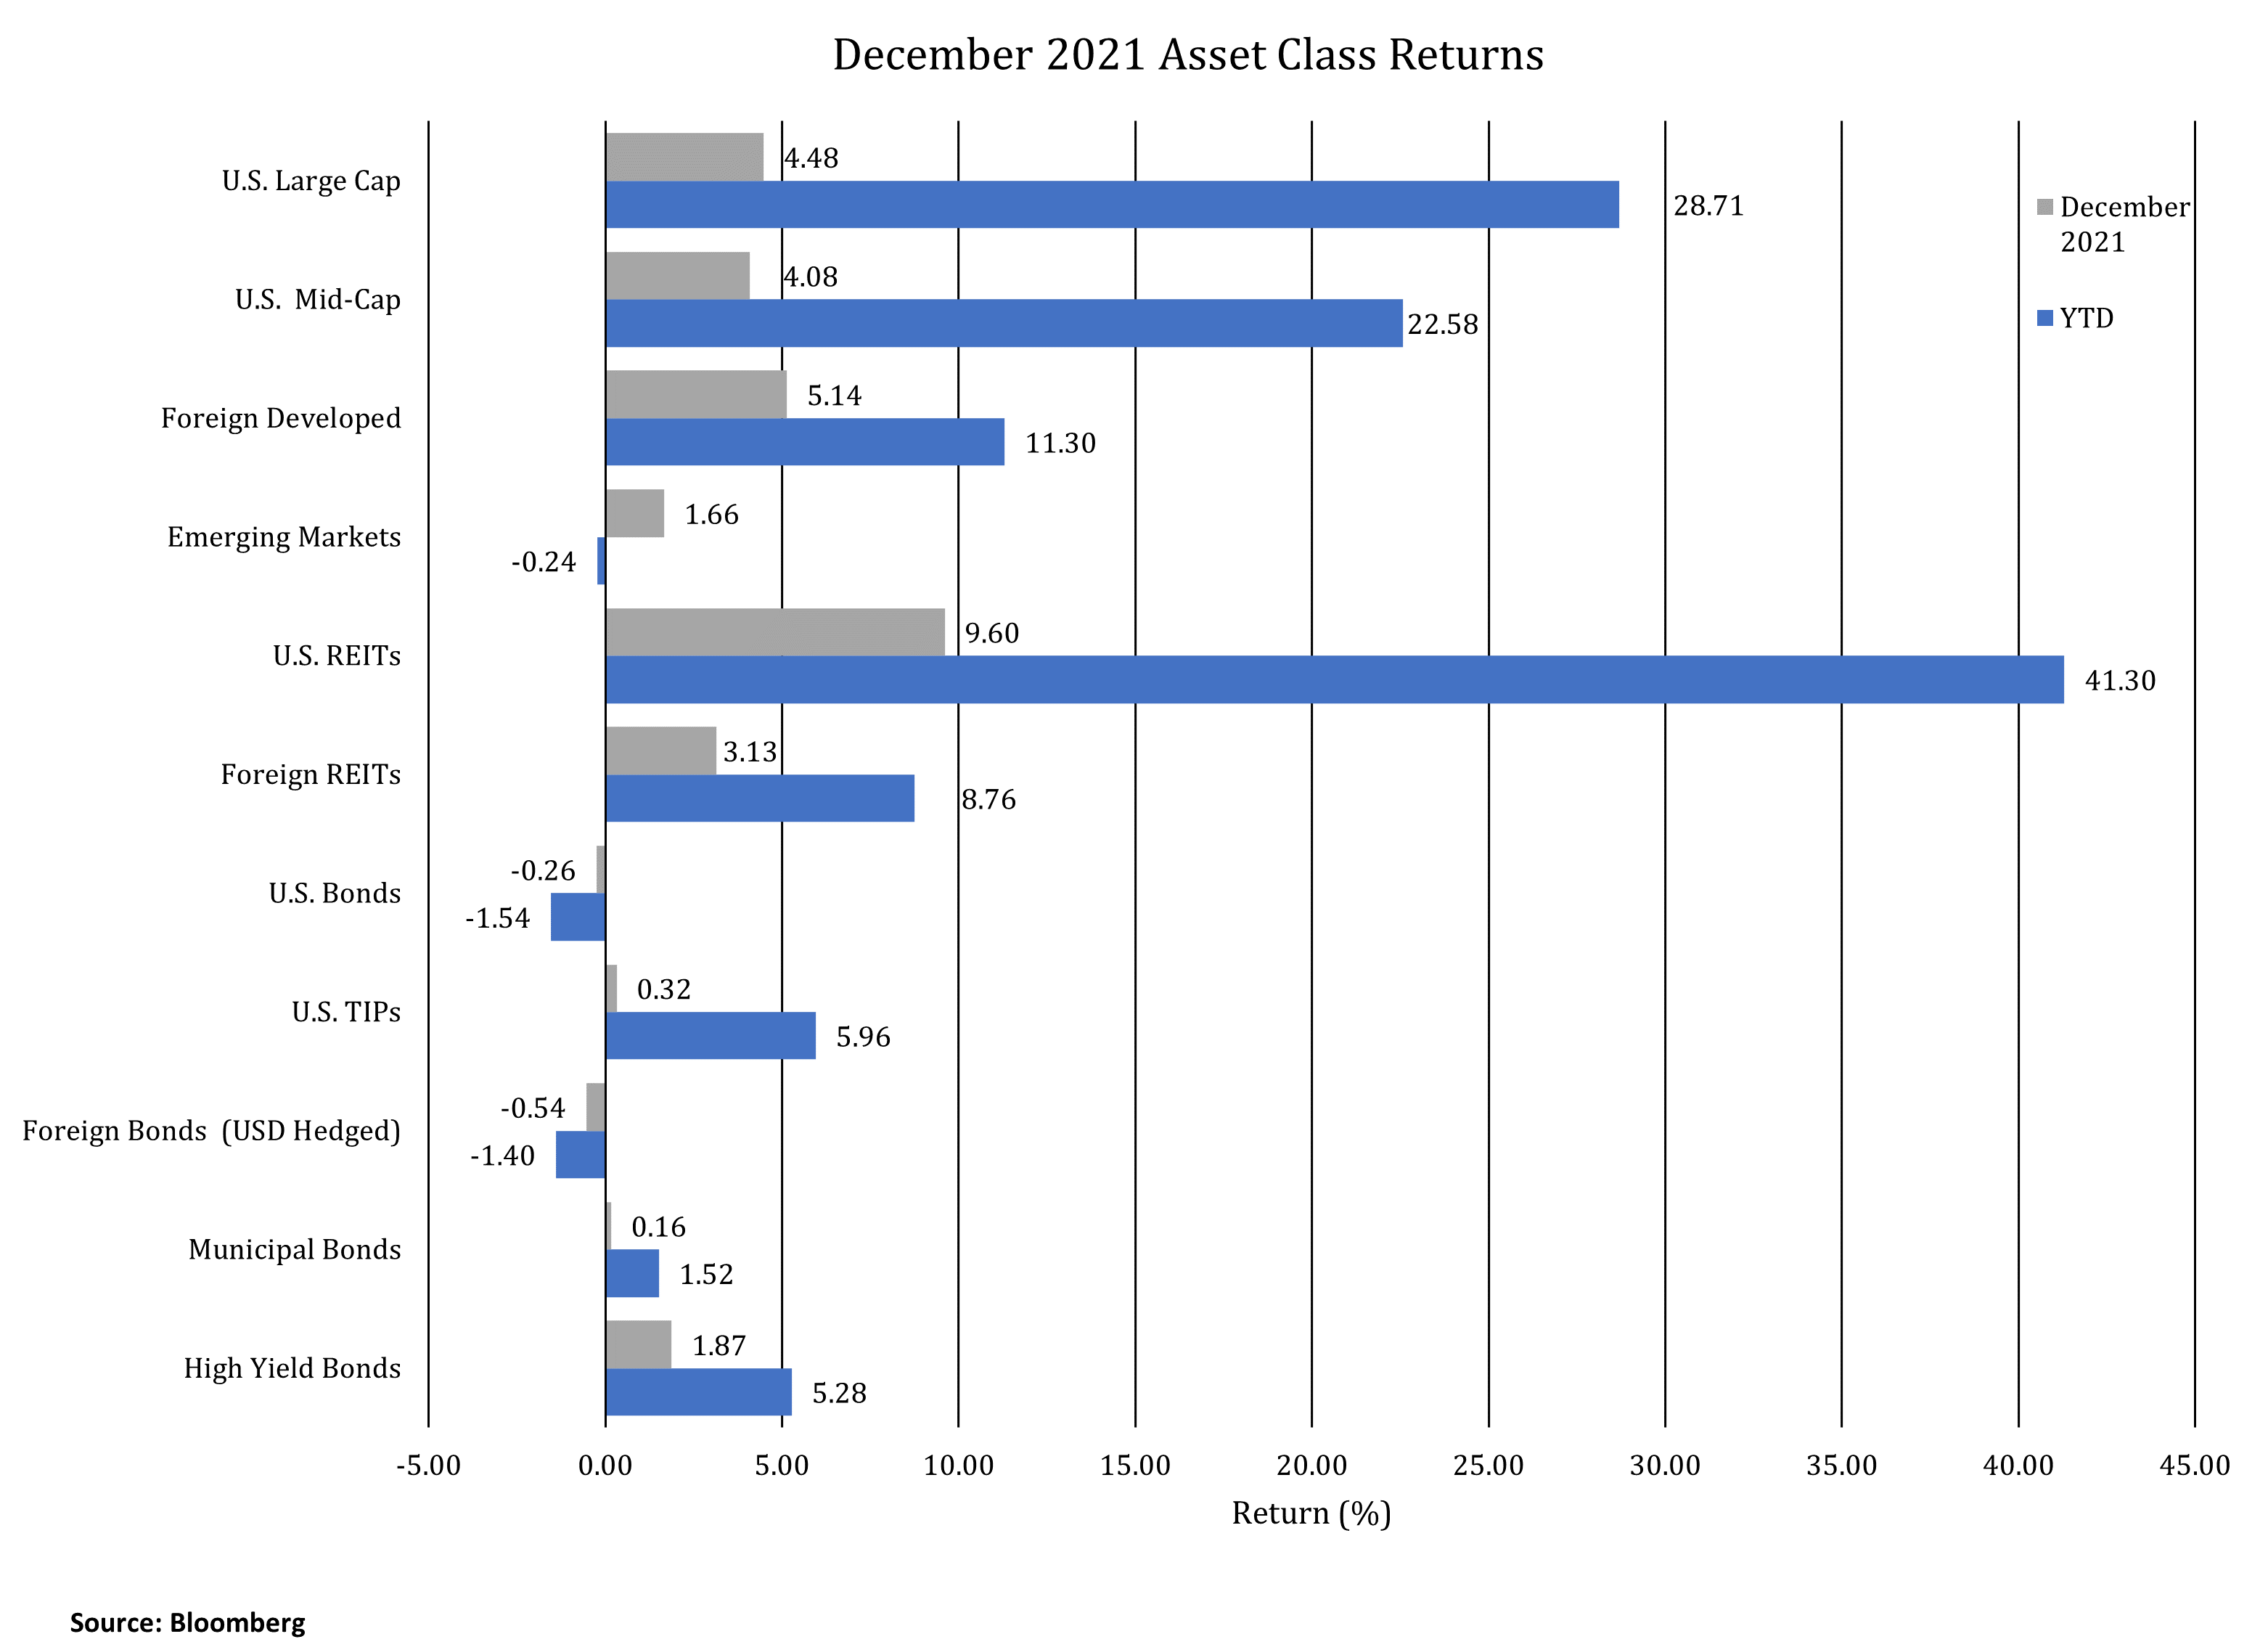
Equity asset classes rose in December, rebounding after market declines in late November. Markets reacted positively to early medical indications on the COVID Omicron variant. Individuals infected by Omicron have about a 20% reduced risk of needing any hospital care and a 40% lower risk of an overnight hospital stay, compared to those infected with Delta.
In December, the S&P 500 gained 4.5% and finished 2021 with a total return of 28.7%. Other equity asset classes also had a strong December. Of note, U.S. real estate investment trusts (REITs) were up 9.6%. Mid-cap and foreign developed equities also had strong year-end gains. Emerging market equities were up 1.7% in December but down slightly in 2021. The global pandemic coupled with tighter monetary and fiscal policies in China contributed to emerging market weakness.
Bond performance was mixed in December as the yield on 10-year U.S. Treasuries rose slightly from 1.44% to 1.51%. Investment grade U.S. bonds ended the year down 1.54%. High yield bonds performed better with a return of 5.28% for the year. Also, U.S. Treasury Inflation Protected Securities (TIPS) had positive returns in 2021 due to higher inflation expectations.
2021 in Review
Investment performance was strong in 2021 as global economies reopened from government mandated COVID-19 shutdowns.
- 2021 can be evaluated based on the progress of COVID outcomes and by extreme monetary and fiscal stimulus policies.
- Government policy response to COVID had two material unintended consequences in 2021: inflation and employment distortions.
COVID-19 Progress
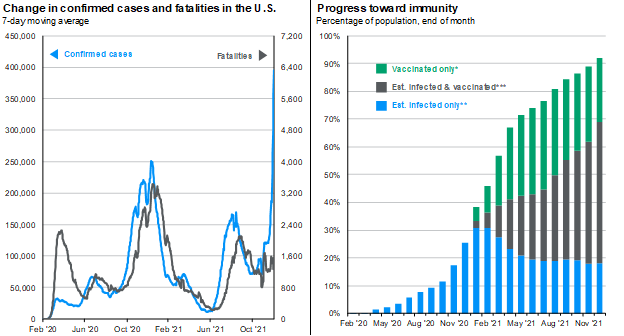
Progress in managing COVID-19 was made in 2021, but not in fully controlling the virus or subsequent variants. The following two charts provide statistics of confirmed cases, fatalities and a measure of immunity.
The chart on the left shows the roller coaster of confirmed cases as testing became available and then the case surges due to the Delta and Omicron variants. The chart on the right shows over 90% of the U.S. population has likely been infected, vaccinated, or both. Two positives from the charts are that COVID deaths from the Omicron variant have not spiked and the U.S. may be closer to the end of the pandemic.
Economic Stimulus
The U.S. economy has been sustained by the Federal Reserve (Fed) holding short-term interest rates near zero and flooding the economy with liquidity through aggressive bond buying. In addition, the federal government issued multiple rounds of stimulus checks, enhanced unemployment benefits, advanced child tax credits and passed a roughly $1 trillion Infrastructure Investment and Jobs Act. All of these were policy reactions to the pandemic. They have led to higher stock prices and rising home prices.
The Fed’s balance sheet at the end of 2021 stood at over $8.7 trillion and has doubled over the last two years. This represents almost 30% of the $29 trillion national debt. Modern Monetary Theory (MMT), operating under the premise that a government can borrow without consequences, appears to be more accepted as mainstream by policymakers. As a firm, JMG does not subscribe to either MMT or uncontrolled government deficit spending. Indeed, the inflation spike of 2021 may be connected to the degree of the pandemic response.
Inflation
The Fed recently changed its characterization of inflation from transitory to persistent. Through November, the headline Consumer Price Index (CPI) was 6.9% while the Producer Price Index was 9.7%. Two-thirds of the rise in CPI can be attributed to year-over-year inflation from four elements: gasoline (58.1%), food at home (6.4%), food away from home (5.8%) and used vehicles (31.4%). The combination of these CPI components and high PPI is likely to add to inflation over the first half of 2022.
Global demand for traditional oil and natural gas in 2021 was relatively unchanged. However, energy producers reduced capital spending on new projects by 75% from peak levels. This has led to supply shortages and contributed to higher gasoline prices.
The lock-downs created global supply chain issues. Individuals increased spending for goods and reduced spending for services. Demand for computer and telecommunications equipment, semiconductors, tools, lumber and home furnishings surged. Manufacturers were no longer able to rely on efficient supply chains for “just-in-time” inventory management. In response they increased demand for production components. The resulting supply-demand imbalances fueled inflation.
Employment
The pandemic response has significantly distorted employment and labor dynamics, but progress has been made in getting employment restored to pre-pandemic levels. In 2021, the U.S. unemployment rate fell from 6.7% to 3.9%, just above the February 2020 level of 3.5%. Nonfarm payroll employment, which fell by 20 million persons at the start of the pandemic, currently stands at 149 million persons, about 4 million short from the pre-pandemic high. The trend has been slow, but improving.
The composition and nature of the labor force is changing. Baby boomers are leaving the workforce and retiring sooner, impacting recent worker shortages. The ability to offer higher wage rates in certain industries (processing and delivery) and not others (retail and hospitality) is contributing to the changing composition of the workforce as employees switch to better work opportunities. These labor forces may contribute to higher wage rates.
2022 Views and Commentary
The following are views impacting our recommendations in 2022:
- Global economic conditions normalize as COVID therapeutic treatments are utilized
- Equities continue to be aided by the COVID economic restart but the pace of global growth may be slowing
- Stocks are expensive on an absolute basis but cheap relative to bonds
- U.S. corporate profits continue to rise but with possible inflation headwinds
- Earnings growth in China and Japan is expected to outpace U.S growth
- Central banks reduce stimulus and Fed could raise rates three times
- Inflation is more “persistent” in the range of 3.0%-3.5% while supply chain issues continue to be worked out
- Record labor demand continues but Omicron interrupts workers’ return to the workforce
- Housing shortages could maintain elevated home prices and rents
Equities
Numerous potential pitfalls may increase volatility and reduce returns in 2022. Even if the direct impact of COVID-19 diminishes, the major side effects of reducing stimulus, fighting inflation and normalizing employment could bring challenges. We do not expect a global recession. Geopolitical issues from China, Russia and the Middle East remain risks for the equity markets.
Assuming COVID subsides, economic activity begins to normalize, earnings growth is reasonable and inflation begins to moderate, it is reasonable for the S&P 500 to continue to move higher, albeit with greater volatility than has been recently experienced.
International equities have more attractive valuations and dividend yields relative to the U.S. The MSCI All-Country World ex-US Index has a P/E of 14.3 times earnings compared to the S&P 500 of 21.2 times earnings. The discount is as deep as it has been in over twenty years.
Fixed Income
U.S. Treasury yields are expected to trend higher in 2022. Fixed income investors should expect muted returns. However, JMG continues to recommend allocations to fixed income as a hedge against equity risk.
Treasury Inflation Protected Securities (TIPS) performed well in 2021 as inflation expectations increased, but may not do as well in 2022. High yield bonds could be helped by a strengthening economy, but current spreads are quite narrow. Negative fixed income returns are possible as interest rates move to higher levels.
Conclusion
2021 was a rewarding year for investors. We expect 2022 to be more challenging but with the potential to still earn solid returns. There is a higher chance of volatility and mid-year drawdowns, both of which were below normal levels in 2021.
Please contact your JMG advisor with questions or concerns.
Important Disclosure
Please remember that past performance may not be indicative of future results. Different types of investments involve varying degrees of risk, and there can be no assurance that the future performance of any specific investment, investment strategy, or product made reference to directly or indirectly in this writing, will be profitable, equal any corresponding indicated historical performance level(s), or be suitable for your portfolio. Due to various factors, including changing market conditions, the content may no longer be reflective of current opinions or positions. Moreover, you should not assume that any discussion or information contained in this writing serves as the receipt of, or as a substitute for, personalized investment advice from JMG Financial Group, Ltd. To the extent that a reader has any questions regarding the applicability of any specific issue discussed above to his/her individual situation, he/she is encouraged to consult with the professional advisor of his/her choosing. JMG is neither a law firm nor a certified public accounting firm and no portion of the content provided in this writing should be construed as legal or accounting advice. A copy of JMG’s current written disclosure statement discussing advisory services and fees is available for review upon request.
To the extent provided in this writing, historical performance results for investment indices and/or categories have been provided for general comparison purposes only, and generally do not reflect the deduction of transaction and/or custodial charges, the deduction of an investment management fee, nor the impact of taxes, the incurrence of which would have the effect of decreasing historical performance results. It should not be assumed that your account holdings correspond directly to any comparative indices. Indices are not available for direct investment. Market Segment (index representation) as follows: U.S. Large Cap (S&P 500 Total Return); U.S. Mid-Cap (Russell Midcap Index Total Return); Foreign Developed (FTSE Developed Ex U.S. NR USD); Emerging Markets (FTSE Emerging NR USD); U.S. REITs (FTSE NAREIT Equity Total Return Index); Foreign REITs (FTSE EPRA/NAREIT Developed Real Estate Ex U.S. TR); U.S. Bonds (Bloomberg US Aggregate Index); U.S. TIPs (Bloomberg US Treasury Inflation-Linked Bond Index); Foreign Bonds (USD Hedged) (Bloomberg Global Aggregate Ex US TR Hedged); Municipal Bonds (Bloomberg US Municipal Bond Index); High Yield Bonds (Bloomberg US Corporate High Yield Index).