

Company Size Disparity – Valuations Still Matter
INVESTMENT COMMITTEE COMMENTARY May 2023
In May, investors continued to evaluate inflation data and the probabilities for the Federal Reserve’s (Fed’s) next interest rate policy moves. The Fed raised the federal funds target rate by 25 basis points in May, which was expected. It remains uncertain whether the Fed will raise interest rates again in June. Some Fed officials suggest that a pause would be warranted even as inflation remains well above the Fed’s 2% target.
Separately, the ramifications from negotiations in Washington on lifting the U.S. debt ceiling contributed to market volatility. With the resolution of the debt ceiling drama, the focus of investors turns towards the timing and severity of the expected recession and the potential impact slowing global economic growth will have on corporate earnings.
The consumer price index (CPI) for April ticked down slightly to 4.9%. The housing and food components of CPI remain stubbornly high at about 8%, while most other components of CPI are showing modest declines. The CPI components reflect elevated price pressures and when coupled with fairly strong employment statistics, could make it harder for the Fed to pause rate hikes.
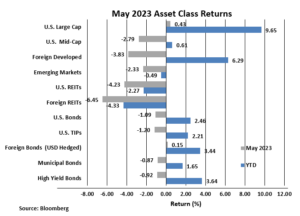
The S&P 500 gained 0.4%, led by strong performance in the technology sector which represents 28% of the index. Foreign developed and emerging markets equities fell 3.8% and 0.5%, respectively. Mid-cap stocks and REITs trailed the S&P 500 as these asset classes have much lower weightings of better-performing technology sector stocks.
Rising bond yields led to negative performance for investment grade bonds. The yield on 10-year Treasuries rose from 3.44% to 3.64%. As a result, the Bloomberg U.S. Aggregate Bond Index return fell by 1.1%. Monthly bond performance remains consistent with the changes in interest rates.
Company Size Disparity – Valuations Still Matter
Through May, U.S. small and mid-cap (SMID) stock performance has lagged the S&P 500. As a result, the valuation differences between large and SMID stocks have widened. This means the large-cap stocks that have driven 2023 stock performance are more expensive than the broader set of U.S. stocks which include SMID stocks.
Fundamentals and momentum can take turns moving the markets and impacting valuations. Currently, U.S. large-cap growth stocks are more expensive based upon the measure of the price/earnings ratio, which has risen to 24.6 vs. the 20-year average of 18.7. Conversely, U.S. small-cap value stocks have a price/earnings ratio which is less expensive at 15.2 vs. the 20-year average of 16.8. Low price/earnings ratios tell us little about what performance will be in, say, the next year, but can provide information on the prospects for performance over longer periods.
JMG recommends global, diversified investment portfolios. Broad market indexes have very different weightings to the various sectors. For example, the S&P 500 holds a 28% technology weighting while the MSCI All-Country World Index holds a 13% weighting, and the Russell Mid-Cap Index holds 16%. These differences have an impact on performance.
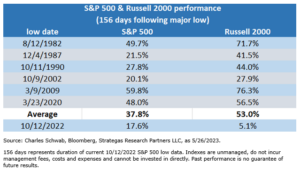
We continue to favor asset allocations to mid-cap and small-cap stocks in addition to large-cap stocks. Mid-cap stocks have outperformed the S&P 500 over the last 20 years. The performance of small-cap stocks has historically been better following market lows and in the early stages of the economic cycle. As shown in the chart below from Charles Schwab & Co., the most recent underperformance for small-cap stocks (Russell 2000 Index) has been contrary to historical outperformance following major market lows.
However, there are multiple periods where a small cap premium is exhibited. Today, small-cap stocks should be considered as an asset class with a more favorable price point.
JMG believes that large-cap stocks are generally the most important driver of capital appreciation for investors over the long-term, but given the current state of the economy, there is more to the market than just the largest companies. As economic cycles turn, we would expect our allocations to small-cap and mid-cap companies to add value, especially given their more attractive valuations.
If you have any questions, please consult your JMG Advisor.
Important Disclosure
Please remember that past performance may not be indicative of future results. Different types of investments involve varying degrees of risk, and there can be no assurance that the future performance of any specific investment, investment strategy, or product (including the investments and/or investment strategies recommended or undertaken by JMG Financial Group Ltd. (“JMG”), or any non-investment related content, made reference to directly or indirectly in this writing will be profitable, equal any corresponding indicated historical performance level(s), be suitable for your portfolio or individual situation, or prove successful. Due to various factors, including changing market conditions and/or applicable laws, the content may no longer be reflective of current opinions or positions. Moreover, you should not assume that any discussion or information contained in this writing serves as the receipt of, or as a substitute for, personalized investment advice from JMG. To the extent that a reader has any questions regarding the applicability of any specific issue discussed above to his/her individual situation, he/she is encouraged to consult with the professional advisor of his/her choosing. JMG is neither a law firm, nor a certified public accounting firm, and no portion of the content provided in this writing should be construed as legal or accounting advice. A copy of JMG’s current written disclosure Brochure discussing our advisory services and fees is available upon request. If you are a JMG client, please remember to contact JMG, in writing, if there are any changes in your personal/financial situation or investment objectives for the purpose of reviewing/evaluating/revising our previous recommendations and/or services, or if you would like to impose, add, or to modify any reasonable restrictions to our investment advisory services. JMG shall continue to rely on the accuracy of information that you have provided.
To the extent provided in this writing, historical performance results for investment indices and/or categories have been provided for general comparison purposes only, and generally do not reflect the deduction of transaction and/or custodial charges, the deduction of an investment management fee, nor the impact of taxes, the incurrence of which would have the effect of decreasing historical performance results. It should not be assumed that your account holdings correspond directly to any comparative indices. Indices are not available for direct investment.
Market Segment (index representation) as follows: U.S. Large Cap (S&P Total Return); U.S. Mid-Cap (Russell Midcap Index Total Return); Foreign Developed (FTSE Developed Ex U.S. NR USD); Emerging Markets (FTSE Emerging NR USD); U.S. REITs (FTSE NAREIT Equity Total Return Index); Foreign REITs (FTSE EPRA/NAREIT Developed Real Estate Ex U.S. TR); U.S Bonds (Bloomberg US Aggregate Bond Index); U.S. TIPs (Bloomberg US Treasury Inflation-Linked Bond Index); Foreign Bond (USD Hedged) (Bloomberg Global Aggregate Ex US TR Hedged); Municipal Bonds (Bloomberg US Municipal Bond Index); High Yield Bonds (Bloomberg US Corporate High Yield Index).