

Cash, Certificates of Deposit (CDs) and Fixed Income Investments
INVESTMENT COMMITTEE COMMENTARY August 2023
Stocks fell in August based on the two common market themes of this year: concerns regarding inflation and uncertainty on Fed policy and the trajectory of interest rate hikes.
The headline Consumer Price Index (CPI) has now dropped to 3.3%, significantly lower than the inflation peak of 8.9% in June 2022. Approximately 69% of the decrease has come from the gasoline and food-at-home categories. Based on CPI, progress is being made on inflation. Of note, the Fed prefers using another inflation index, the Core Personal Consumption Expenditures (PCE) Price Index and the decline in this index also has met market expectations. However, the Federal Reserve Bank of San Francisco highlighted a narrower inflation category focused on core services that excludes shelter costs. This narrower category is called “super core” inflation and the Fed is more focused on services where inflation continues to increase or remain elevated. The issue is while core goods inflation has continued declining, core services inflation has not. In fact, super core inflation jumped to 3.9% in July, up from 3.2% in June. Therefore, the Fed may continue a more hawkish stance and hold interest rates higher for a while longer. As a result, the markets took a pause in August and equities fell back.
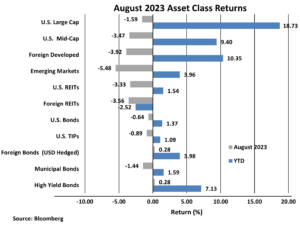
The S&P 500 fell 1.6% in August but remains up 18.7% for the year. Other equity asset classes underperformed the S&P 500, generally falling between 3% and 4% for the month. Of note, economic data at the end of August bolstered soft-landing hopes and the last week of the month brought a relief rally of about 2%.
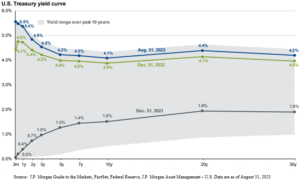
Rising bond yields impacted bond performance in August. The yield on 10-year Treasuries rose from 3.95% on July 31st to 4.36% on August 22nd before falling back to 4.09% at the end of the month. As a result, the Bloomberg U.S. Aggregate Bond Index return fell by 0.6%. Municipal bonds fell by 1.4%, hurt by elevated supply and expensive valuations at the start of the month. However, high yield bonds and foreign bonds (USD hedged) each had positive monthly returns of 0.3%.
Cash, Certificates of Deposit (CDs) and Fixed Income Investments
The U.S. Treasury yield curve is inverted, which means that yields on short-term Treasuries are higher than long-term Treasuries. This situation occurs less frequently and often in periods of a weakening economy or impending recession. The chart below illustrates a normal yield curve from 2021 and the recent inverted yields. In such periods, investors often consider options for the best way to manage their cash. For this purpose, cash is defined in a broader sense to include hard currency, cash in bank accounts, money market funds, and liquid holdings of short-term Treasury bills. The Fed reports that cash, in total, amounts to about $17 trillion for U.S. households.
Today, some may find it enticing to shift assets out of longer-term bonds to higher yielding money market funds and CDs. These cash savings may go well above the normal cash cushion needed for daily living expenses, emergency fund reserves, near-term planned needs, college expenses, travel, and peace of mind cash for uncertain times. The amount of cash to be reserved is an individual decision based on individual circumstances. Where possible, investment of cash should be held in higher yield money funds or CDs rather than in non-interest bearing accounts.
However, there is a trade-off with longer duration bonds which yield less now, but which would be expected to earn higher long-term total returns. The trade-off is that while cash assets have higher yields now, the yields will fall as interest rates decline and there is no opportunity for the value to increase. Intermediate duration bonds have lower yields than cash now, but those yields are set for longer and as the economic cycle turns and interest rates fall, the value of intermediate bonds will increase to provide a greater total return. This bond effect is the opposite of the markets of 2022 when interest rates were rising. Investing at peak CD rates in the past has resulted in underperformance relative to other riskier assets across both stocks and bonds.
The chart below illustrates the strong bond performance for the 12 months after Fed rate hike cycles for the Bloomberg U.S. Agg Index ranging from 6% to as high as 30%.
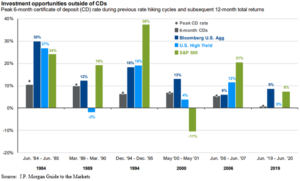
The above chart is compelling and argues to maintain discipline in the fixed income and equity asset allocations established during the financial planning process. For long-term investing and investment growth, we continue to advocate allocation strategies targeting positive long-term real return, after inflation.
If you have any questions, please consult your JMG Advisor.
Important Disclosure
Please remember that past performance may not be indicative of future results. Different types of investments involve varying degrees of risk, and there can be no assurance that the future performance of any specific investment, investment strategy, or product (including the investments and/or investment strategies recommended or undertaken by JMG Financial Group Ltd. (“JMG”), or any non-investment related content, made reference to directly or indirectly in this writing will be profitable, equal any corresponding indicated historical performance level(s), be suitable for your portfolio or individual situation, or prove successful. Due to various factors, including changing market conditions and/or applicable laws, the content may no longer be reflective of current opinions or positions. Moreover, you should not assume that any discussion or information contained in this writing serves as the receipt of, or as a substitute for, personalized investment advice from JMG. To the extent that a reader has any questions regarding the applicability of any specific issue discussed above to his/her individual situation, he/she is encouraged to consult with the professional advisor of his/her choosing. JMG is neither a law firm, nor a certified public accounting firm, and no portion of the content provided in this writing should be construed as legal or accounting advice. A copy of JMG’s current written disclosure Brochure discussing our advisory services and fees is available upon request. If you are a JMG client, please remember to contact JMG, in writing, if there are any changes in your personal/financial situation or investment objectives for the purpose of reviewing/evaluating/revising our previous recommendations and/or services, or if you would like to impose, add, or to modify any reasonable restrictions to our investment advisory services. JMG shall continue to rely on the accuracy of information that you have provided.
To the extent provided in this writing, historical performance results for investment indices and/or categories have been provided for general comparison purposes only, and generally do not reflect the deduction of transaction and/or custodial charges, the deduction of an investment management fee, nor the impact of taxes, the incurrence of which would have the effect of decreasing historical performance results. It should not be assumed that your account holdings correspond directly to any comparative indices. Indices are not available for direct investment.
Market Segment (index representation) as follows: U.S. Large Cap (S&P Total Return); U.S. Mid-Cap (Russell Midcap Index Total Return); Foreign Developed (FTSE Developed Ex U.S. NR USD); Emerging Markets (FTSE Emerging NR USD); U.S. REITs (FTSE NAREIT Equity Total Return Index); Foreign REITs (FTSE EPRA/NAREIT Developed Real Estate Ex U.S. TR); U.S Bonds (Bloomberg US Aggregate Bond Index); U.S. TIPs (Bloomberg US Treasury Inflation-Linked Bond Index); Foreign Bond (USD Hedged) (Bloomberg Global Aggregate Ex US TR Hedged); Municipal Bonds (Bloomberg US Municipal Bond Index); High Yield Bonds (Bloomberg US Corporate High Yield Index).