

A Pause in Disinflation
INVESTMENT COMMITTEE COMMENTARY February 2023
After a strong January, both stocks and bonds had negative returns in February. January presented investors hope of easing inflation, but February revealed increasing inflation pressures. The Consumer Price Index (CPI) and the Personal Consumption Expenditures (PCE) Price Index rose 0.5% and 0.6%, respectively, the most since last June. Overall, there is not enough progress on inflation and there is a higher risk the Federal Reserve (Fed) will continue to hike short-term interest rates through 2023. The Fed has consistently maintained that it seeks to achieve maximum employment and hold inflation at a rate of 2.0%.
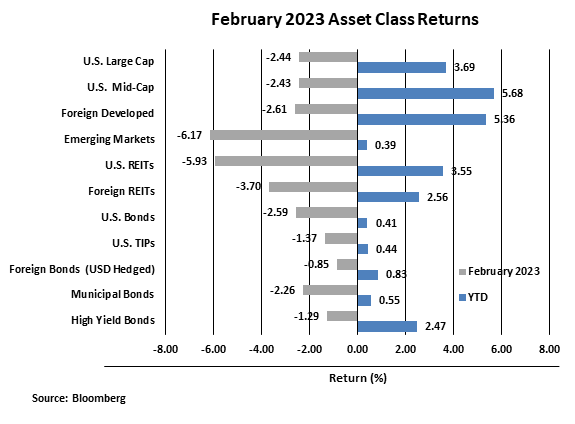
As a result, stocks and bonds fell in February. The S&P 500 dropped 2.4%. Foreign developed and emerging market equities declined 2.6% and 6.2%, respectively. This was due, in part, to the U.S. dollar strengthening amid perceived higher geopolitical risks and fears of U.S. interest rates staying higher for longer.
Bond prices also fell as the yield on 10-year Treasuries rose from 3.52% to 3.92%, about the same level as the beginning of the year. U.S. intermediate investment grade bonds declined 2.6%. The Treasury yield curve remains deeply inverted, with the yield on one-year bonds well above the 10-year yield, at 5.02%.
While February was a difficult month for the markets, all major asset classes are still positive year-to-date.
A Pause in Disinflation
Investor optimism about the Fed’s battle against inflation in January was derailed in February when economic data suggested the Fed still has more work to do. A catalyst that helps explain January’s strong market performance and February’s weak market performance is disinflation.
Much has been made of Fed Chairman Powell’s numerous references to disinflation in his February press conference. Disinflation is the decline in inflation. Inflation is measured by the year-over-year increase in prices measured by CPI. The rate of increase peaked last June at 9.0% and was 6.3% most recently. So, prices were still rising, but at a slower pace.
Through 2022, investors watched the Fed dramatically hike short-term interest rates to reduce inflation. Stocks fell on recession fears and the end of accommodative monetary policy. Now, investors are trying to gauge just how much more the Fed needs to do and whether inflation is moving towards the Fed’s target.
The markets may continue to experience volatility as economic data is released providing more clarity on whether disinflation can take hold again. If not, the Fed will likely have to be more aggressive with its rate hikes. If the disinflation trend restarts, the Fed can relax their policy decisions. Inflation data can be complicated. It includes a variety of sub-measures that can be contradicting such as rent (housing), food, energy, medical, and gasoline. Each CPI component may move differently, over time, and so disinflation may have a slower or faster pace with each month’s readings. This is why we have seen periods of market volatility and less sustained equity rallies.
While the inflation/disinflation data seems to have driven the early year market returns, it is not something we would attempt to time from a tactical perspective. Maintaining our allocation discipline in this environment will be the most effective approach. Our fixed income allocations should benefit from the higher interest rate environment as yields are now at the most attractive levels seen since before the financial crisis. Equity valuations, though not cheap, are reasonable and should lead to attractive results over the long-term. If the inflation/disinflation question continues to drive volatility, we will look for rebalancing and, perhaps, tactical opportunities.
If you have any questions, please consult your JMG Advisor.
Important Disclosure
Please remember that past performance may not be indicative of future results. Different types of investments involve varying degrees of risk, and there can be no assurance that the future performance of any specific investment, investment strategy, or product (including the investments and/or investment strategies recommended or undertaken by JMG Financial Group Ltd. (“JMG”), or any non-investment related content, made reference to directly or indirectly in this writing will be profitable, equal any corresponding indicated historical performance level(s), be suitable for your portfolio or individual situation, or prove successful. Due to various factors, including changing market conditions and/or applicable laws, the content may no longer be reflective of current opinions or positions. Moreover, you should not assume that any discussion or information contained in this writing serves as the receipt of, or as a substitute for, personalized investment advice from JMG. To the extent that a reader has any questions regarding the applicability of any specific issue discussed above to his/her individual situation, he/she is encouraged to consult with the professional advisor of his/her choosing. JMG is neither a law firm, nor a certified public accounting firm, and no portion of the content provided in this writing should be construed as legal or accounting advice. A copy of JMG’s current written disclosure Brochure discussing our advisory services and fees is available upon request. If you are a JMG client, please remember to contact JMG, in writing, if there are any changes in your personal/financial situation or investment objectives for the purpose of reviewing/evaluating/revising our previous recommendations and/or services, or if you would like to impose, add, or to modify any reasonable restrictions to our investment advisory services. JMG shall continue to rely on the accuracy of information that you have provided.
To the extent provided in this writing, historical performance results for investment indices and/or categories have been provided for general comparison purposes only, and generally do not reflect the deduction of transaction and/or custodial charges, the deduction of an investment management fee, nor the impact of taxes, the incurrence of which would have the effect of decreasing historical performance results. It should not be assumed that your account holdings correspond directly to any comparative indices. Indices are not available for direct investment.
Market Segment (index representation) as follows: U.S. Large Cap (S&P Total Return); U.S. Mid-Cap (Russell Midcap Index Total Return); Foreign Developed (FTSE Developed Ex U.S. NR USD); Emerging Markets (FTSE Emerging NR USD); U.S. REITs (FTSE NAREIT Equity Total Return Index); Foreign REITs (FTSE EPRA/NAREIT Developed Real Estate Ex U.S. TR); U.S Bonds (Bloomberg US Aggregate Bond Index); U.S. TIPs (Bloomberg US Treasury Inflation-Linked Bond Index); Foreign Bond (USD Hedged) (Bloomberg Global Aggregate Ex US TR Hedged); Municipal Bonds (Bloomberg US Municipal Bond Index); High Yield Bonds (Bloomberg US Corporate High Yield Index).