

Key Issues Shaping Markets in Late 2025
INVESTMENT COMMITTEE COMMENTARY August 2025
U.S. stocks enjoyed a notable month in August with the S&P 500 and Dow indexes reaching record highs. Wall Street’s performance was largely driven by strong corporate earnings (particularly in technology), an improved trade outlook and continued economic resilience. The information technology sector was the primary driver of the market’s growth, with mega-cap firms, particularly artificial intelligence (AI) and semiconductor companies, fueling the upturn.
Of note in August is the weak pattern in employment growth, not only in 2025 but also during the summer months of 2024. This year’s string of weak reports and revisions started in May. In examining the details, private non-farm employment is principally being held up by the health care sector. Outside of health care, there is general stagnation in employment. It is still unclear whether the “summer swoon” similarities of the last two years are temporary or if employment decline drivers of 2025 signal a more ominous issue.
The bond market in August was influenced by a combination of factors including Fed monetary policy, economic data, geopolitical events, and ongoing tariff discourse. Ten-year Treasury yields were volatile throughout August but generally trended lower after Fed Chair Powell’s dovish comments suggesting an interest rate reduction in September. The yield on 10-year Treasuries fell from 4.37% to 4.23%. The Bloomberg U.S. Aggregate Bond Index gained 1.2% for the month.
Of note, the two-year Treasury note, which is more sensitive to Fed policy, closed August at 3.59%, compared to 3.94% last month. Also, the U.S. dollar demonstrated a period of stabilization and mixed performance in August, following a decline in the first half of the year.
![]()
Key Issues Shaping Markets in Late 2025
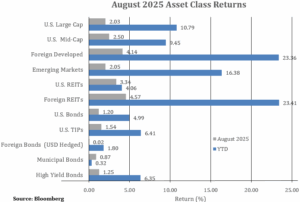
As illustrated in the chart above, investment performance through August has been positive. Three key market factors will play a part in determining whether the markets will continue to advance through year-end.
Stagflation Risk – Stagflation is defined as the simultaneous occurrence of rising prices (inflation), slow or negative economic growth, and high unemployment. Because tariffs are a tax on economic activity, the higher tariffs proposed by the administration and accepted by U.S. trading partners pose the risk of triggering stagflation. So far, the U.S. economy (as measured by gross domestic product – headline GDP) has been quite resilient despite geopolitical and market uncertainties.
Typically, economists prefer to see private domestic activity driving economic growth. And for most of the post-COVID period, this has been the case. However, for the last three quarters, Core GDP, also known as private domestic economic activity (defined as headline GDP less imports and changes in inventories) has been falling while headline GDP has been rising. This discrepancy has been caused by falling personal consumption expenditures and slowing capital investment, particularly in the second quarter. The data may show cracks in both U.S. economic growth and the resilience upon which investors have been relying, or the data may be reflecting a transitory reaction to the administration’s change in trade policy. The result may in turn impact asset prices.
Fed Rate Cut – Single Rate Cut or Start of a Cycle? – Stocks rallied in August as the Fed commentaries appeared to confirm investor hopes for multiple rate cuts over the next year. Lower rates will reduce borrowing costs and stimulate the economy, potentially offsetting the impact of tariffs and the slowdown which appears to be taking hold. More broadly, the market is digesting the ongoing tension between the administration and the Fed regarding the level and pace of rate cuts. The Fed continues to be “data driven” – meaning they plan to adjust policy based on the economic data. The administration is pushing for faster rate cuts to keep the economy growing – and has put unprecedented pressure on the Fed, including attempting to fire one Fed governor, Lisa Cook.
Beyond the immediate outlook, it appears that the administration’s influence over the Fed will be growing as Powell approaches the end of his term as Fed Chair. Investors appear to be expecting that the next Fed Chair will be more accommodative and support a cycle of rate cuts, which will stimulate the economy (a positive for stocks), but may also risk reigniting inflation.
Magnificent Seven (Mag 7): Big Technology and Technology Related Companies – As of August 31st, the top ten stocks of the S&P 500 represent 39% of the index, a concentration which is at a near record historical level. Robust earnings growth of these top companies needs to continue for strong equities performance to continue, or leadership needs to be picked up by other companies. JP Morgan reports that 55% of S&P 500 returns in 2024 were attributable to the Mag 7 (Alphabet/Google, Amazon, Apple, Meta, Microsoft, NVIDIA and Tesla). Through August 2025, that percentage fell to 39%. Further, Mag 7 earnings growth between 2024 and 2025 (forecasted) is falling from 48% to 21%, and to 16% in 2026. The decline in growth is being offset by increasing earnings growth from non-Mag 7 companies.
Artificial intelligence (AI) and AI-linked company expectations have again surged to extreme valuations. Due to the powerful investor sentiment embedded in these stock prices, unexpected weaknesses in business results could result in stock market underperformance. Specifically, if material doubts emerge about the impact of AI, the decline in the equity markets could be more significant.
In summary, stock indexes are high today and performing relatively well because of positive investor expectations, especially those relating to the economic outlook, Fed rate cuts, and big-tech performance. Currently, the above three factors sufficiently meet investors’ expectations so that stock indices are holding at higher levels.
If you have any questions, please consult your JMG Advisor.
Important Disclosure
Please remember that past performance may not be indicative of future results. Different types of investments involve varying degrees of risk, and there can be no assurance that the future performance of any specific investment, investment strategy, or product (including the investments and/or investment strategies recommended or undertaken by JMG Financial Group Ltd. (“JMG”), or any non-investment related content, made reference to directly or indirectly in this writing will be profitable, equal any corresponding indicated historical performance level(s), be suitable for your portfolio or individual situation, or prove successful. Due to various factors, including changing market conditions and/or applicable laws, the content may no longer be reflective of current opinions or positions. Moreover, you should not assume that any discussion or information contained in this writing serves as the receipt of, or as a substitute for, personalized investment advice from JMG. To the extent that a reader has any questions regarding the applicability of any specific issue discussed above to his/her individual situation, he/she is encouraged to consult with the professional advisor of his/her choosing. JMG is neither a law firm, nor a certified public accounting firm, and no portion of the content provided in this writing should be construed as legal or accounting advice. A copy of JMG’s current written disclosure Brochure discussing our advisory services and fees is available upon request. If you are a JMG client, please remember to contact JMG, in writing, if there are any changes in your personal/financial situation or investment objectives for the purpose of reviewing/evaluating/revising our previous recommendations and/or services, or if you would like to impose, add, or to modify any reasonable restrictions to our investment advisory services. JMG shall continue to rely on the accuracy of information that you have provided.
To the extent provided in this writing, historical performance results for investment indices and/or categories have been provided for general comparison purposes only, and generally do not reflect the deduction of transaction and/or custodial charges, the deduction of an investment management fee, nor the impact of taxes, the incurrence of which would have the effect of decreasing historical performance results. It should not be assumed that your account holdings correspond directly to any comparative indices. Indices are not available for direct investment.
Market Segment (index representation) as follows: U.S. Large Cap (S&P Total Return); U.S. Mid-Cap (Russell Midcap Index Total Return); Foreign Developed (FTSE Developed Ex U.S. NR USD); Emerging Markets (FTSE Emerging NR USD); U.S. REITs (FTSE NAREIT Equity Total Return Index); Foreign REITs (FTSE EPRA/NAREIT Developed Real Estate Ex U.S. TR); U.S Bonds (Bloomberg US Aggregate Bond Index); U.S. TIPs (Bloomberg US Treasury Inflation-Linked Bond Index); Foreign Bond (USD Hedged) (Bloomberg Global Aggregate Ex US TR Hedged); Municipal Bonds (Bloomberg US Municipal Bond Index); High Yield Bonds (Bloomberg US Corporate High Yield Index).