

The Iran War, Policy Developments and the AI Evolution
INVESTMENT COMMITTEE COMMENTARY March 2026
With the recent market volatility and economic uncertainty from the war in Iran and global geopolitical tensions, we first address recent events before providing our March 2026 market commentary.
The War: From Initial Shock Toward Defined Objectives
Multiple issues have been pressuring U.S. equity and bond markets. However, the Iran war was the catalyst leading to a first quarter peak to trough S&P 500 drawdown of about 9%. While meaningful, this drawdown should be framed within the context that historical intra-year declines average 14.2%.
The U.S. massive attack on Iran sparked a war that effectively closed the Strait of Hormuz and drastically reduced available global oil supplies. Crude oil prices surged significantly to over $100/bbl. With the significant increase in oil prices, both the S&P 500 and global equities traded lower. Further, military actions have expanded to multiple countries in the region.
At present, a shaky ceasefire remains in place, but the situation remains fluid even as the initial shock of the war is wearing off with more definition in the battle lines. Importantly, the two sides are beginning to negotiate, but it remains uncertain whether details will be worked out at the negotiating table or on the battlefield. Iran’s future is at stake as to its leadership, future nuclear capability, control over the Strait of Hormuz, sanctions, reparations, and its place within the international community.
Market Impacts
Overall, investors can expect continued elevated market volatility. Oil has been especially volatile, rising to a range of $110 to $115/bbl and then falling back with news of breakthroughs in negotiations. Commodity markets do adapt over time as new supplies come online, and consumers adjust demand so the effect of the energy shock may be mitigated over time.
Stock markets have fallen with non-U.S. markets more impacted due to their reliance on oil from the Persian Gulf region. However, even with the recent decline, non-U.S. markets continue to outperform U.S. markets for the year. There are also positive factors to be considered, including a still-resilient economy and reasonably stable corporate earnings. Additional positive factors include a broad decrease in stock market valuations and anticipated higher income tax refunds associated with the recent tax act changes that are expected to be received by taxpayers in the coming weeks. However, market patience for the war to end is not indefinite. The impact of higher oil prices and potentially lower economic growth are beginning to be priced into the markets.
Policy Developments and the AI Evolution
Besides Iran, other issues and geopolitical events remain unsettled which also add to market volatility.
US Government Policies
- The U.S. Tariff regime continues to evolve after the Supreme Court rulings, adding uncertainty to corporate planning, supply chains and price levels.
- The federal government remains in a partial shutdown as Congress debates funding the Department of Homeland Security, creating episodic volatility particularly when shutdown risk or policy deadlines approach.
- The U.S. continues its more aggressive approach to international relations, influencing alliance structures, defense spending expectations and cross-border investment sentiment.
The AI Evolution
- AI continues to progress, but emphasis appears to be shifting from massive development of infrastructure to how the technology will be employed, and the potential effects on specific industries.
- The impact on software company valuations has been sharp, which carried over to some private credit lenders.
- AI presents both an opportunity and a threat to companies of all types, and there will be winners and losers. Companies who can adapt will be rewarded with improved margins and possibly market share, while the laggards will struggle.
Fed Policy, Growth, and Inflation
- The macroeconomic backdrop has become more complex.
- The war and geopolitical stress have boosted inflation expectations, and potentially reduced global growth expectations, posing the risk of stagflation.
- The Fed has adjusted its stance from leaning towards additional rate cuts to a more neutral outlook, pending developments in the Iran War. Other central banks are taking similar approaches.
- On the positive side, economic growth and corporate earnings are reasonably stable and are supporting markets.
In environments like this, the most common investor error is letting the news cycle dictate portfolio changes. Headlines can change faster than fundamentals, and markets can reverse quickly in either direction. We make recommendations and invest by considering uncertainties but not by market timing efforts based on geopolitical events. We cannot emphasize enough that the approach to navigating more volatile market periods is to stay invested, maintain diversification and appropriate time horizon. Rebalance rather than react as volatility can create opportunities to add to long-term positions at better prices. It is a consistent theme to achieve successful market outcomes. Portfolios should seek broad global diversification across regions and asset classes and with higher quality.
March 2026 Commentary
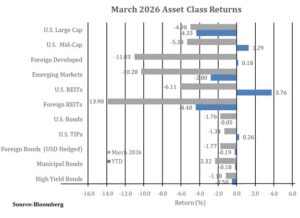
The U.S. stock market ended the month on a disappointing note, as the S&P 500 and the Bloomberg U.S. Aggregate Bond Index gave up their positive returns from the first two months of the year. For the month, these indexes fell -5.0% and -1.8%, respectively. Foreign developed and emerging market equities fell sharply with the war in Iran, down -11.0% and -10.3%, respectively. Year-to-date, the foreign developed and emerging asset classes are still outpacing the S&P 500.
Despite a backdrop of geopolitical volatility and sticky inflation, U.S. corporations exhibited resilience and broadening growth. FactSet projects double-digit earnings growth for the sixth straight quarter. In spite of recent declines, information technology (IT) and communication services sectors remain the primary engines of growth. While, the energy sector has seen some of the largest upward revisions in earnings per share (EPS).
Crude oil prices entered 2026 on relatively stable footing, only to experience one of the most turbulent quarters in history. Crude oil prices began the year at around $57.50/bbl, driven lower by abundant supply. The oil market’s entire trajectory changed with prices rising to over $100/bbl in late March. The retail price for regular gasoline was $3.99/gallon on March 30 which was $1.05/gallon above the price at the end of February and $0.83/gallon more than the price a year ago.
The first quarter saw gold prices deliver one of the most volatile periods in years. After surging to historic highs at the beginning of the year, gold prices fell dramatically mid-quarter before leveling off at the end of March. Ultimately, gold prices ended the quarter well below their January peak but still elevated relative to 2025 year-end values.
Bonds had negative performance in March as 10-year Treasury yields rose from 3.97% to 4.30% at the end of the month. The Federal Reserve maintained a cautious policy stance while monitoring for rising inflation which may be delaying the interest rate cuts investors were previously expecting.
We continue to diligently monitor the investment environment and the opportunities and risks that may impact recommended allocations.
If you have any questions, please consult your JMG Advisor.
Important Disclosure
Please remember that past performance may not be indicative of future results. Different types of investments involve varying degrees of risk, and there can be no assurance that the future performance of any specific investment, investment strategy, or product (including the investments and/or investment strategies recommended or undertaken by JMG Financial Group Ltd. (“JMG”), or any non-investment related content, made reference to directly or indirectly in this writing will be profitable, equal any corresponding indicated historical performance level(s), be suitable for your portfolio or individual situation, or prove successful.
This content is provided for educational purposes only. Due to various factors, including changing market conditions and/or applicable laws, the content may no longer be reflective of current opinions or positions. Moreover, you should not assume that any discussion or information contained in this writing serves as the receipt of, or as a substitute for, personalized investment advice from JMG. To the extent that a reader has any questions regarding the applicability of any specific issue discussed above to his/her individual situation, he/she is encouraged to consult with the professional advisor of his/her choosing. JMG is neither a law firm, nor a certified public accounting firm, and no portion of the content provided in this writing should be construed as legal or accounting advice.
A copy of JMG’s current written disclosure Brochure discussing our advisory services and fees is available upon request. If you are a JMG client, please remember to contact JMG, in writing, if there are any changes in your personal/financial situation or investment objectives for the purpose of reviewing/evaluating/revising our previous recommendations and/or services, or if you would like to impose, add, or to modify any reasonable restrictions to our investment advisory services. JMG shall continue to rely on the accuracy of information that you have provided.
To the extent provided in this writing, historical performance results for investment indices and/or categories have been provided for general comparison purposes only, and generally do not reflect the deduction of transaction and/or custodial charges, the deduction of an investment management fee, nor the impact of taxes, the incurrence of which would have the effect of decreasing historical performance results. It should not be assumed that your account holdings correspond directly to any comparative indices. Indices are not available for direct investment.
Market Segment (index representation) as follows: U.S. Large Cap (S&P Total Return); U.S. Mid-Cap (Russell Midcap Index Total Return); Foreign Developed (FTSE Developed Ex U.S. NR USD); Emerging Markets (FTSE Emerging NR USD); U.S. REITs (FTSE NAREIT Equity Total Return Index); Foreign REITs (FTSE EPRA/NAREIT Developed Real Estate Ex U.S. TR); U.S Bonds (Bloomberg US Aggregate Bond Index); U.S. TIPs (Bloomberg US Treasury Inflation-Linked Bond Index); Foreign Bond (USD Hedged) (Bloomberg Global Aggregate Ex US TR Hedged); Municipal Bonds (Bloomberg US Municipal Bond Index); High Yield Bonds (Bloomberg US Corporate High Yield Index).