

2025 in Review
INVESTMENT COMMITTEE COMMENTARY December 2025
Wall Street performance wavered in December impacted by the Federal Reserve’s (Fed) policy decisions and short-term momentum shifts in the technology sector. The markets were also impacted by the delayed release of a large influx of economic data following the 43-day government shutdown. Full economic data from the shutdown is still not available.
As expected, following its meeting in December, the Fed reduced the federal funds rate by 25 basis points (0.25%) to the current target rate of 3.50%-3.75%. In arriving at its decision, the Committee noted that economic activity continued to expand at a moderate pace; job gains have slowed, the unemployment rate increased, while inflation increased since earlier in the year and remained somewhat elevated. As to future policy actions, the Fed will continue to monitor the implications of incoming information for its economic outlook and adjust the stance of monetary policy if economic risks emerge. As to projections for future interest rate adjustments, the Fed estimates very gradual declines over the next few years.
The Consumer Price Index (CPI) increased 0.2% from September 2025 to November 2025 (it is worth noting that no data was reported for October). The CPI less food and energy also rose 0.2% over the same two months. Over the last 12 months, the CPI increased 2.7% after rising 3.0% over the 12 months ended in September.
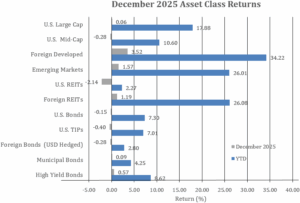
The S&P 500 gained 0.1% in December, finishing another strong year, up 17.9%. Foreign developed and emerging market equities rose 3.5% and 1.6%, respectively, in December. For the year, these asset classes rose 34.2% and 26.0%, respectively, outpacing the S&P 500.
Bonds had weaker December performance as 10-year Treasury yields rose from 4.02% to 4.18%. Currently, the 10-year Treasury yield is generally trading in a range between 4.0% and 4.2%. The Bloomberg U.S. Aggregate Bond Index (AGG) fell by 0.2% for the month. Other bond sub-indexes were roughly flat except for high yield bonds which rose by 0.6%. Fixed income returns in 2025 were solid based on both higher starting yields and the decline in yields over the course of the year.
![]()
2025 in Review
The year 2025 was extraordinary for the economy and the markets. Sweeping tariffs, a cooling labor market, rising consumer prices, a prolonged U.S. federal government shutdown, turmoil in the Middle East, and the ongoing Russia/Ukraine war were some of the many factors that could have signaled economic contraction and a downturn in the stock market. Yet, the opposite occurred. Gross domestic product (GDP) expanded, largely driven by strong consumer spending. Major stock market indexes posted solid year-end gains. Corporate profits and earnings grew despite the unemployment rate increasing to its highest level since September 2021.
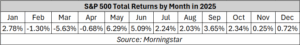
The following chart shows monthly total returns of the S&P 500 and illustrates sentiment inflection points throughout 2025.
Selected Issues and Highlights of 2025
- Department of Government Efficiency (DOGE) – Led by Elon Musk, DOGE implemented aggressive spending cuts and federal workforce reductions. While proponents cited long-term savings, the immediate impact included disruptions to government services and a government shutdown in October. More recently, some of the workforce reductions have been partially reversed as with the Internal Revenue Service (IRS) to improve service and to update still existing 50-year-old technology.
- Tariffs / Liberation Day – Early in the year, President Trump rolled out a round of tariffs across a wide range of imported goods. In anticipation of April 2nd “Liberation Day” and as shown in the chart above, equity markets fell. With uncertainty from potential tariff outcomes, investors worried about possible recession and rising inflation. Also, the value of the U.S. dollar fell against major foreign currencies. U.S. Treasuries, normally viewed as a safe haven, also sold off pulling bond prices lower, and pushing yields higher. From mid-year on, new trade agreements prompted a reduction in some tariff rates on certain imports, helping to calm investors’ concerns.
- Inflation – In 2025, the consumer price index (CPI) declined to 2.4% in March, the last reading before Liberation Day. Since then, CPI has risen higher to 3.0% in September before dropping to 2.7% in November. Using the March benchmark date, we gain a sense of the impact on CPI since tariff implementation which for headline CPI is 0.3%. However, CPI-Ex-Shelter may be a better metric to measure the full effect of tariffs, and that impact since March is 1.0%. This data explains why there is hesitancy by some Fed members to further lower rates because there appears to be upward pressure on inflation.
- Employment – Data from the Bureau of Labor Statistics is not fully reestablished. The most recent Official Unemployment Rate (November) is 4.6%. Labor markets appear to be weakening but not dramatically. Employment might be characterized as too strong to be weak, but too weak to be strong. Total private nonfarm payrolls flattened with the year-over-year change from November at just 0.78%. While there were gains in the size of the labor force, there was also a rise in the number of people unemployed. Full-time employment is declining in favor of part-time employment. The employment data is more consistent with a late-stage economic environment which can have higher market volatility.
- S&P 500 / Market Drivers – Despite geopolitical headwinds and valuation concerns, equities delivered a robust year, largely fueled by the continued artificial intelligence (AI) boom and a resilient consumer. Market drivers in 2025 included AI enthusiasm, anticipated Fed rate cuts, stable economic growth, CPI trends, and corporate earnings growth. Economic data was complicated by the government shutdown which delayed public announcements and certainly complicated the interpretation of such data due to the timing of the releases. Somewhat of a surprise, markets seemed to look past sudden geopolitical events and shifting policies, delays in timing of Fed rate cuts, stagflation, some labor market duress, and the government shutdown.
- International Markets – Weakness in the U.S. dollar provided a tailwind for non-U.S. stocks in 2025 for U.S. dollar-based investors. In local currency, the MSCI All Country World ex-U.S. index had a return of 25.1% but after the currency effect, the return to U.S. investors was 33.1%. Of note, even the local currency foreign stock returns outperformed the S&P 500 in 2025, a reversal from prior years.
2026 Outlook and Commentary
Markets begin the new year riding an impressive three-year winning streak that’s been powered by rate cuts, solid economic growth and extreme investor enthusiasm over AI. The three-year rally with returns of 84% ranks this market in the top 6% of three-year returns over the last 100 years. The positive factors that generated these returns remain in place as we begin 2026 and a continuation higher would not be unprecedented. However, stock market valuations remain at elevated levels, which historically have eventually led to cyclical bear markets.
Investor enthusiasm for the productivity and profit-boosting potential of AI has been the main fuel behind this remarkable three-year bull market, and as we start 2026, AI enthusiasm remains broadly in place. In fact, major U.S. tech companies remain committed to spending hundreds of billions of dollars on AI infrastructure buildout and that should continue to power broader economic growth and strong tech sector earnings growth.
Despite major shifts in global trade policy and the longest government shutdown in U.S. history, the economy starts the new year on solid footing. Major economic metrics regarding consumer spending, service sector demand, and business investment are signaling growth which may support risk assets.
In addition, the Fed has cut rates over the past year and a half, easing the headwind on the U.S. economy. Despite some uncertainty about the number of future rate cuts in 2026, investors still expect a generally “dovish” Fed as projections show another rate cut in the new year while a new Fed chair (likely to be appointed soon, and who will take office in May) is expected to push harder for more rate cuts and generally be more dovish than current Fed Chair Powell.
As a potential source of volatility, U.S. Supreme Court decisions regarding the President’s authority to impose tariffs under IEEPA and the President’s ability to remove Fed Governors are expected early in the year. These need to be carefully monitored. If tariffs are struck down, that could cause volatility due to continued policy uncertainty, as could any decisions which are perceived to undermine Fed independence.
Conclusion
The factors that have fueled this three-year bull market remain in place as we start the new year and that means the outlook for markets and risk assets remains positive, though fragile. While the outlook is positive, it is also fair to say the market enters 2026 with weaker tailwinds than it’s had in the past few years. While further gains in the stock market will depend on continued earnings growth, rather than price multiple expansion, weakness could result from any number of factors which could undermine corporate results. We continue to encourage global diversification to reduce risk, capture growth opportunities across multiple markets, and build a more resilient portfolio that can withstand economic fluctuations.
If you have any questions, please consult your JMG Advisor.
Important Disclosure
Please remember that past performance may not be indicative of future results. Different types of investments involve varying degrees of risk, and there can be no assurance that the future performance of any specific investment, investment strategy, or product (including the investments and/or investment strategies recommended or undertaken by JMG Financial Group Ltd. (“JMG”), or any non-investment related content, made reference to directly or indirectly in this writing will be profitable, equal any corresponding indicated historical performance level(s), be suitable for your portfolio or individual situation, or prove successful. Due to various factors, including changing market conditions and/or applicable laws, the content may no longer be reflective of current opinions or positions. Moreover, you should not assume that any discussion or information contained in this writing serves as the receipt of, or as a substitute for, personalized investment advice from JMG. To the extent that a reader has any questions regarding the applicability of any specific issue discussed above to his/her individual situation, he/she is encouraged to consult with the professional advisor of his/her choosing. JMG is neither a law firm, nor a certified public accounting firm, and no portion of the content provided in this writing should be construed as legal or accounting advice. A copy of JMG’s current written disclosure Brochure discussing our advisory services and fees is available upon request. If you are a JMG client, please remember to contact JMG, in writing, if there are any changes in your personal/financial situation or investment objectives for the purpose of reviewing/evaluating/revising our previous recommendations and/or services, or if you would like to impose, add, or to modify any reasonable restrictions to our investment advisory services. JMG shall continue to rely on the accuracy of information that you have provided.
To the extent provided in this writing, historical performance results for investment indices and/or categories have been provided for general comparison purposes only, and generally do not reflect the deduction of transaction and/or custodial charges, the deduction of an investment management fee, nor the impact of taxes, the incurrence of which would have the effect of decreasing historical performance results. It should not be assumed that your account holdings correspond directly to any comparative indices. Indices are not available for direct investment.
Market Segment (index representation) as follows: U.S. Large Cap (S&P Total Return); U.S. Mid-Cap (Russell Midcap Index Total Return); Foreign Developed (FTSE Developed Ex U.S. NR USD); Emerging Markets (FTSE Emerging NR USD); U.S. REITs (FTSE NAREIT Equity Total Return Index); Foreign REITs (FTSE EPRA/NAREIT Developed Real Estate Ex U.S. TR); U.S Bonds (Bloomberg US Aggregate Bond Index); U.S. TIPs (Bloomberg US Treasury Inflation-Linked Bond Index); Foreign Bond (USD Hedged) (Bloomberg Global Aggregate Ex US TR Hedged); Municipal Bonds (Bloomberg US Municipal Bond Index); High Yield Bonds (Bloomberg US Corporate High Yield Index).